How to Create A Process Application Landscape
This tutorial will guide you through creating an interactive Process Application Landscape Overview on the Dragon1 platform. The tutorial will teach you how to publish this visualization on the devices of the stakeholders who want to use it to manage projects, processes, and IT.
This tutorial, from start to finish, takes about four hours if you have never done it before. And if you have created landscapes about four or five times, this tutorial can be done within an hour. You can do this tutorial alone or split the task into a group.
This tutorial teaches you to create a dynamic architecture visualization, not a static architecture visualization. This means that once set up, if the data or the model is changed, the published visualization seen and used by stakeholders via the Viewer on their iPad or iPhone is also automatically updated. Of course, you can also make static backup copies that do not change.
Learning Objectives
The learning objectives are:
- What is a Process Application Landscape?
- Why create a Process Application Landscape?
- Setup a Dossier Structure
- Importing Data
- Defining New Attributes
- Entering and Enriching Data Manually
- Creating a Model
- Connecting the Model with the Data
- Creating Views
- Using a Template
- Drawing Shapes on the Canvas
- Creating Visual Items
- Creating Indicators
- Using Popup Dialogs
- Using Tracking and Tracing
- Using Click-Through Links
- Publishing a Visualization
- Use the Changes and Updates window
- Using the Workflow window
- Using the Comments features
- Filtering the Views and Visualization
- Processing Comments and Messages
- Printing a Report
In the following paragraph, each of these learning objectives is discussed.
What is a process application landscape
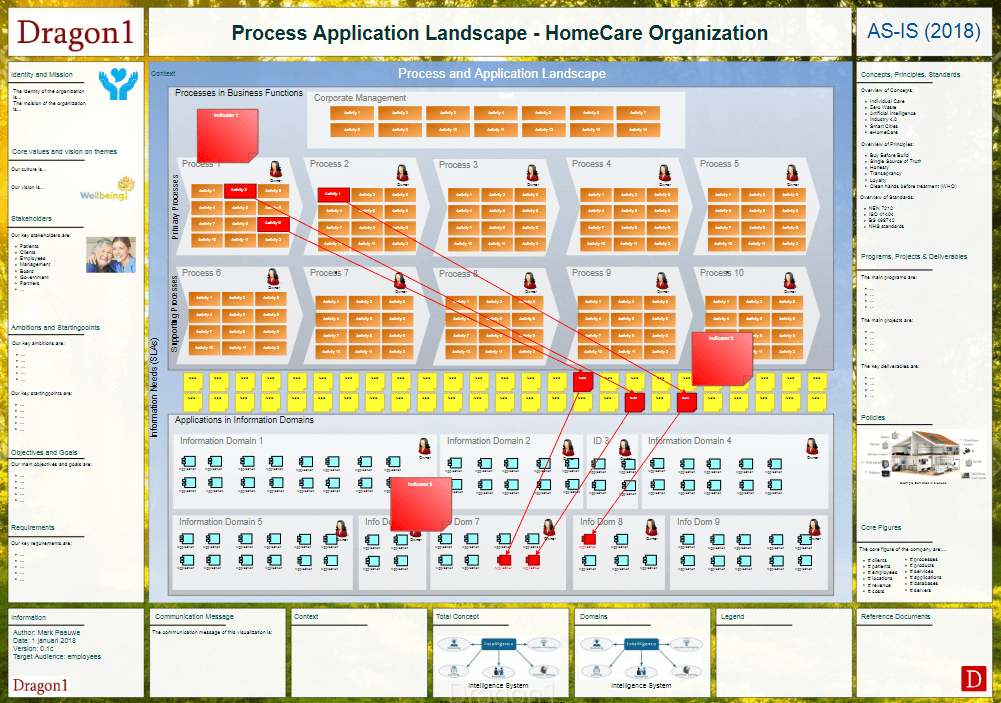
A process application landscape is the structure and coherent set of all-important business functions, business domains, business processes, information systems, services, business objects, modules, functionalities, building blocks, software applications, components, interfaces, and databases, and their platforms, technologies, types, and interdependencies, with regards to business continuity.
The difference between a process application blueprint and a process application landscape is the level of detail and its purpose. The purpose of a blueprint is to guide design and building activities. A blueprint, therefore, contains functional and technical details. The purpose of a landscape is to inform the management of the structure and dependencies. A landscape, therefore, contains generic functional and technical information.
A second definition is that a process application landscape is the management overview of an organization's business processes, business objects, and software applications.
Next to the Dragon1 open EA Method definition, we advise visualizing landscapes using a certain View Layout. Architecture is a total concept seen as the bridge between strategy and transformation. Architecture visualizations are best visualized with strategy on the left side, architecture in the middle, and transformation on the right side. In this way, stakeholders will see at the left 'why things need to be done', in the middle 'how the solutions must be built', and on the right 'how the building of the solutions must be executed'. This way, the architecture visualizations can be used to manage projects and direct changes.
Setup Dossier Structure
If you create a process application landscape, you need to create a cabinet, dossier, and some folders in your repository where you can store data. Typically, you would set up folders like Data, Models, Views, Viewpoints, and Visualizations.
To setup a dossier structure
- Read the Setup Dossier Structure page
Importing Data
You can create a process application overview by automatically importing or entering data manually. So, you either follow this step or skip it and go to the second step.
As said in the definition of a process application landscape, you need certain data to create a process application landscape. This data is often available in all kinds of systems and spreadsheets in your organization. And the data will be stored in the folders you created.
To import data:
- Read the import data page
Defining New Attributes
Dragon1 has by default 400+ Entity classes. Read here more about the Dragon1 EA Modeling Language
Every Entity class by default has ten user data attributes, like name, title, description, type, and a few system data attributes like internal ID. Now, you could want your data attributes for an entity class. You can enter Budget as User Defined Attribute if you want to administer 'Budget' at the stakeholder. You can use that value when importing, entering, and creating views and indicators.
To create user-defined attributes:
- Read the Create User Defined Attributes page
Entering and Enriching Data Manually
We have discussed importing data automatically. Now, we look at entering data manually. It is a task that can easily be accomplished if you want to enter a process or application, or even manually enter 100 processes or 100 applications.
Also, the data you imported can be enriched. Maybe not all fields you need for views and indicators are filled by default.
To enter data manually:
- Read the enter data page
Creating a Model
Now you are at the point where you have data in your folder, but the data is not connected. In this step, we are going to connect the data. Creating relationships between entities is called modeling. You give the data structure, shape/form.
One unique thing is that the model, view, and visualization change automatically when data changes. That is why we create models based on stored data.
You will drag the entities from the folder structure onto a model canvas.
To create a model:
- Read the Create Model page
Connecting the Model with the Data
This step is not always necessary. It could be that the data entities are used to create a model but that the model entity is not interconnected with the data entity (an invisible lifeline, one could say).
If you switch a model to the Normal model, every entity not correctly linked to a data item will be marked red.
To link entities and entity classes in a model correctly with data entities:
- Read the Connect Data With A Model page
Creating Views
After we have one or more models that link the data with each other, we need to define views. As said earlier, the landscape overview is a canvas with many views for various topics (strategy, architecture, and transformation). A view is a filter on a model, so for every topic, we create a view, like mission, stakeholder, requirements, processes, applications, projects, and deliverables.
To create the views for the process application landscape:
- Read the Create View page
Using a Template
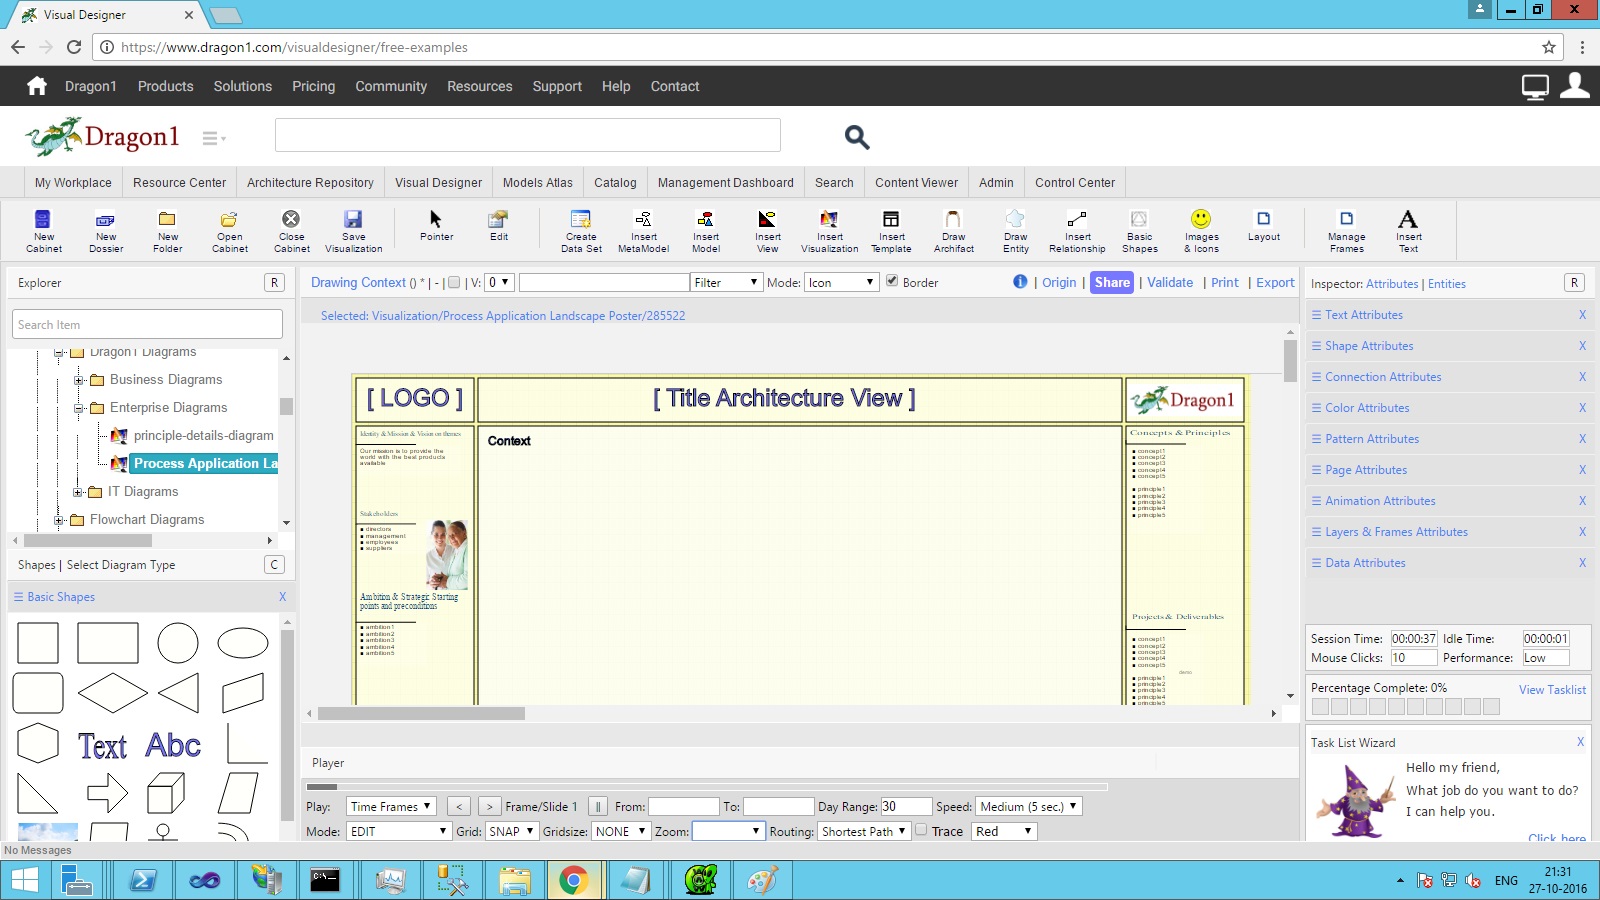
Dragon1 is an EA Tool or platform and an open EA Method. In this method, architecture (as a total concept) is placed between strategy and transformation to act as a bridge or integral enterprise blueprint. In the EA Method, we have prepared a default view layout for architecture visualizations to accommodate strategy, architecture, and transformation. You can insert this template on your canvas.
To use a template on the canvas
- Read the Using a Visualization Template page
Drawing Shapes on the Canvas
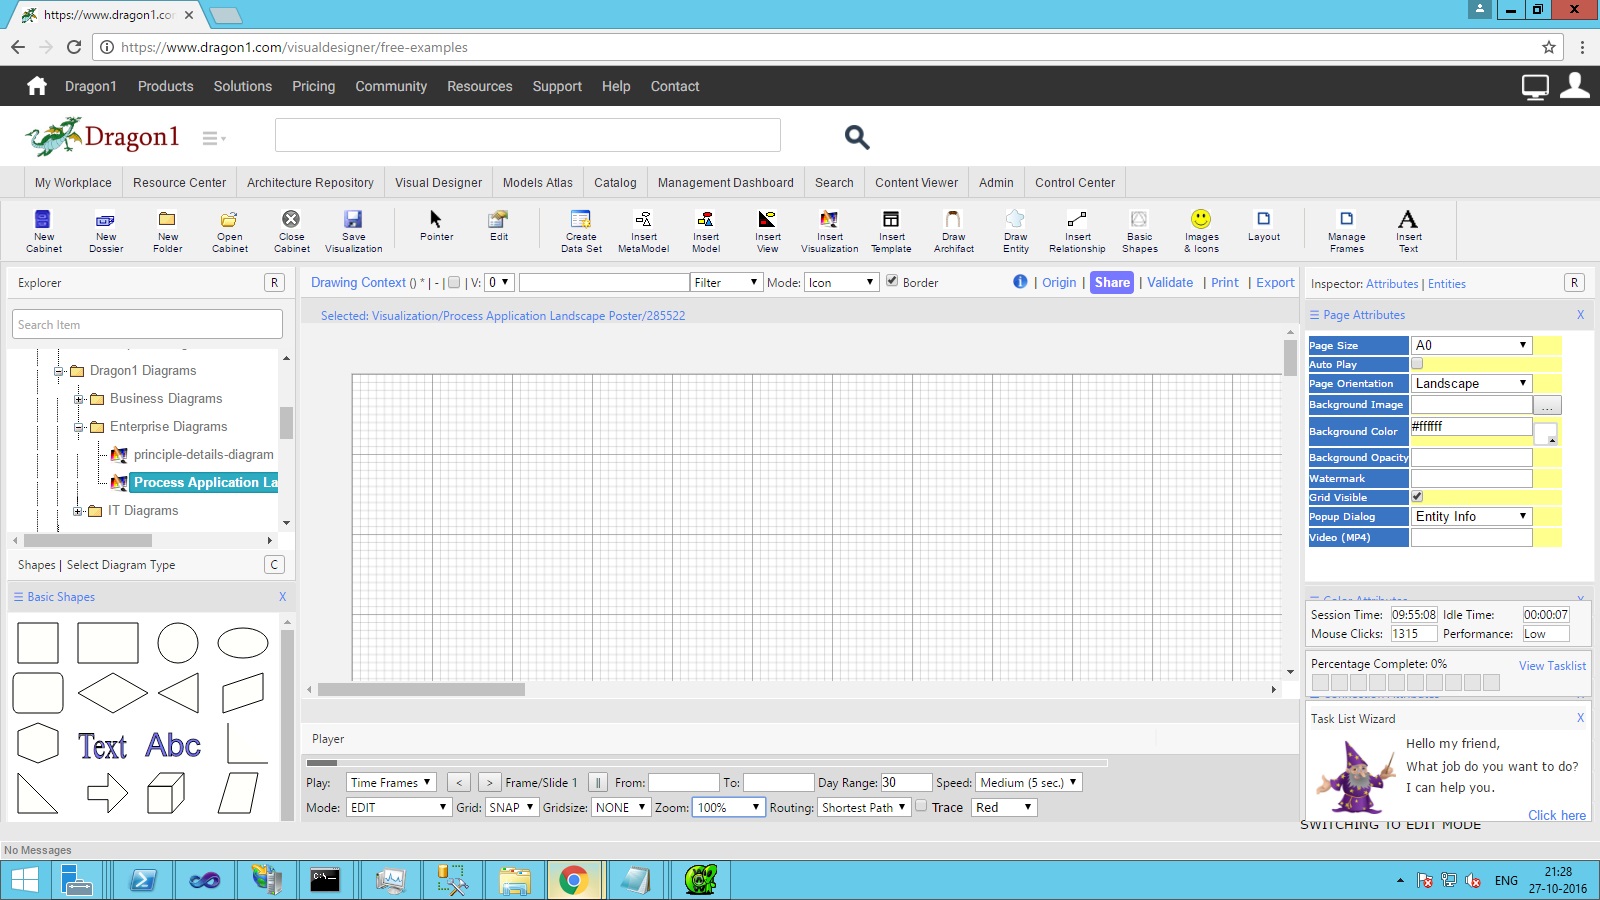
It is time to dress up your canvas with a template. For instance, put a background picture on it, upload a logo, or place a domain layout background on the canvas. Drawing shapes on a canvas is as easy as dragging and dropping an item.
To draw shapes on the canvas
- Read the Drawing Shapes section on this page
Creating Visual Items
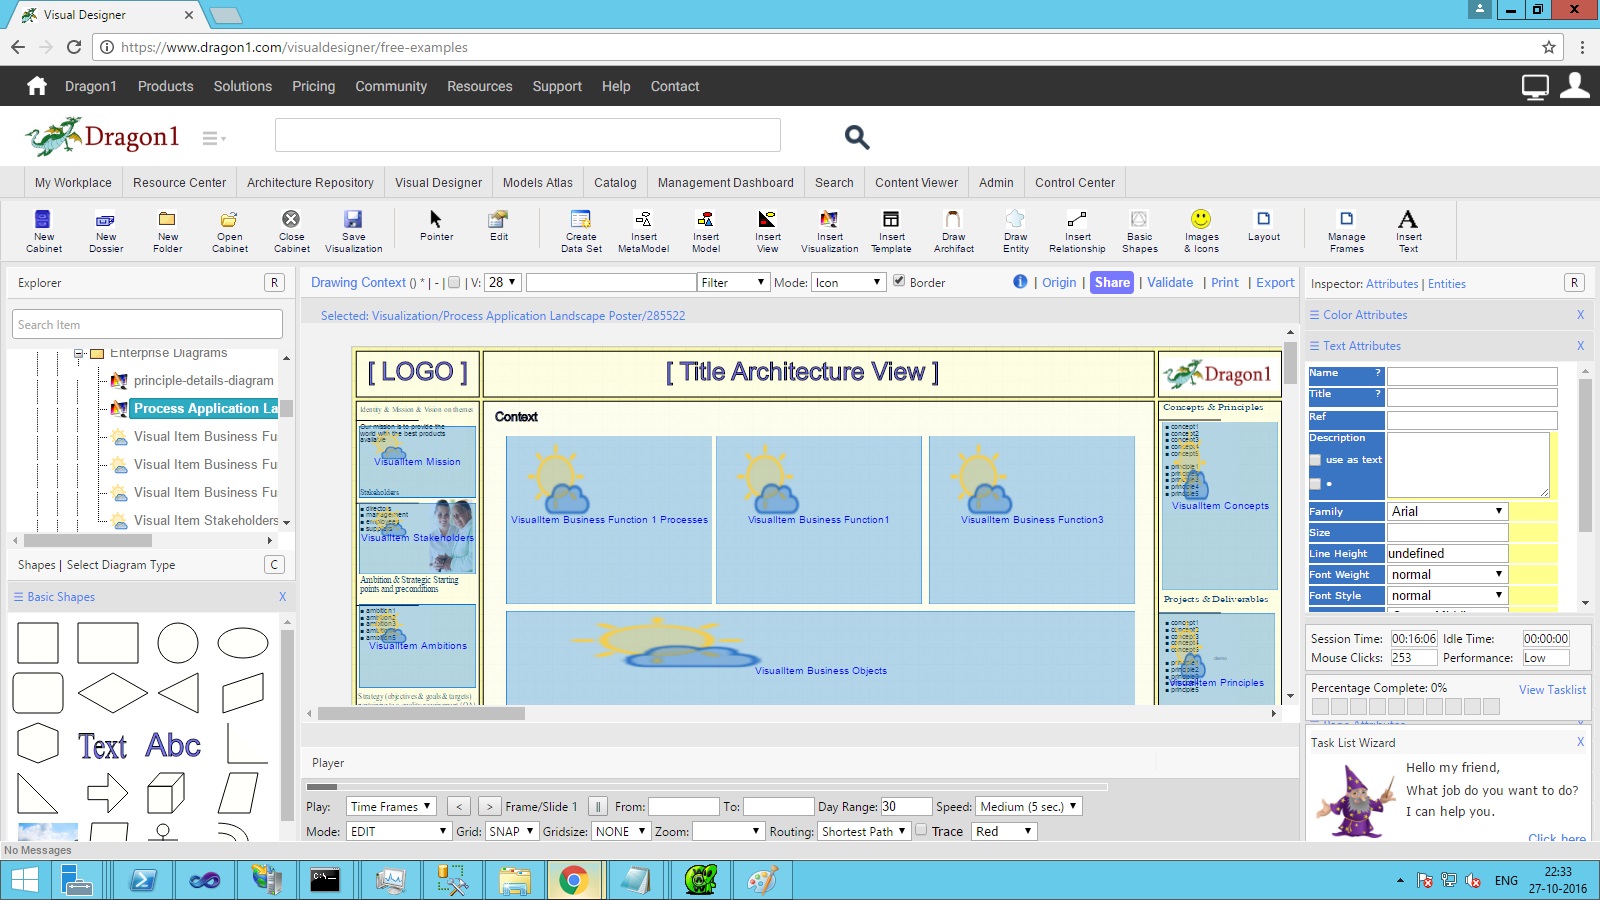
On Dragon1, you link data in a model and create a view to filter data from a model. You place a Visual Item on a visualization canvas to instruct the system to draw the view with certain shapes, sizes, layouts, and colors in the Visual Item area on the canvas. You can place as many views as you like on the same visualization canvas in this view.
To create visual items and draw them on a visualization canvas:
- Read the Create Visual Items page
Creating Indicators
Indicators are specialized Visual Items. Suppose you want all processes not documented to be colored red on a diagram, and you want all the applications that need to be replaced this year to be colored blue. You can do this with a Visual Item. But the easiest way to do that is to make use of an Indicator.
To create indicators and use them on a visualization canvas:
- Read the Create Indicators and Dashboards page
Using Popup Dialogs
On Dragon1, you can generate popup dialogs on mouse-over of your shapes in the Viewer. For this, you need to enter at least a description for your shapes.
To have popup dialog generated on mouse over on an item:
- Read the Working with Popup Dialogs page
Using Tracking and Tracing
When models are big and complex, tracking and tracing helps to see what is and is not connected.
Tracing means showing a path forward from A to B. Tracking means showing a path backward from B to A. Dragon1 supports both.
To make use of tracking and tracing:
- Read the Tracking and Tracing page
Using Click-Through Links
You can create interrelated visualizations using clickable links. That is easy to do. How this works is explained below.
A common practice is creating an overview visualization where you can click on shapes and then be forwarded to detailed visualizations. You can create this scenario. For example, you click on a process or application and are forwarded to a process schema or application design.
To make use of click-through links:
- Read the Working with Clickable links page
Publishing a visualization
To publish your visualization to any device:
- Read the Publish Visualization page
Use the Changes and Updates window
To make use of the changes and updates window in the Viewer:
- Read the Data Changes and Models Updates page
Using the Workflow window
In the Viewer, you can watch who has worked on the visualization and the outstanding tasks for development, usage, and maintenance. Depending on your privileges, you can see certain information or even send messages to people about their tasks.
To make use of the workflow window in the Viewer:
- Read the Tasks Workflow page
Using the Comments features
To make use of the comments feature in the Viewer:
- Read the Add Comments page
Filtering the Views and Visualization
To filter the views and visualizations in the Viewer as a stakeholder:
- Read the Filter Visualizations page
Processing the Comments
Users may have left comments in the Viewer, or you may have been sent messages via the workflow window. As a visualization creator, you need to update and change data, models, views, or the visualization template. Doing that results in changes and updates in Windows updates so everyone can see you have processed their comments and messages. And, of course, someone with the same privileges as you in the same account can also process the comments. In this way, you can collaborate on the platform.
To process the comments that stakeholders entered in the Viewer:
- Read the Process Comments and Messages page
Viewing and Printing a Report
From time to time, you, as creator or manager, will want to print out a report on the progress of creation, usage, and maintenance of the landscape.
To view and print a report:
- Read the View and Print Report page


