How To Create an Application Landscape Diagram
Why do you start creating Application Landscape Diagrams?
An Application Landscape (as an interactive overview A0-sized visualization) is an architecture product that should always be present in your EA baseline, even if outdated. To have something is better than to have nothing because it always saves time and, thus, money searching for certain application interdependencies.
And of course, with a static or interactive overview of the applications, you can do some effective deduplication.
What is an Application Landscape?
An application landscape is a coherent set of interconnected applications, often within an enterprise, business, or organization. An application landscape diagram, also called a system landscape and system architecture diagram, is the visualization of an application landscape.
The benefits of creating an Application Landscape are:
- Many roles in the organization (CIO, administrator, supplier, manager, architect) have much quicker access to information to make decisions.
- A visualization of an application is much more objective and easier to understand (harder to misunderstand) than a textual version.
- The impact of change can be visualized on the drawing table before you do it in practice. Showstoppers can be eliminated.
- You, as an architect, show how well it works to visualize the whole of a complex system and then manage it instead of working with textual documents with partially inconsistent drawings.
- As an architect, you give ideas to others that could be visualized.
- If you, as an application manager, use application software to create a landscape overview, you can try different scenarios to solve problems.
An application landscape shows software and middleware applications' logical and physical grouping, modularity, functionality, and technology. Sometimes, they also work with the databases they use, where objects are handled and stored, the interfaces they communicate with, the locations and hardware/on which operating systems are deployed, and the users and processes they support.
There is no sharp line to say what should or should not be on an application landscape. It is more a matter of what the viewer (stakeholder) wants to see or look at. If you look at a mountain landscape, houses and people might be there, but you do not see them because you are not looking at them.
You will accomplish a lot with an application landscape, depending on what information about the applications you provide. It would be best not to focus on the names of suppliers or products. Instead, it would be best to focus on process ownership, IT costs, business benefits, functionality, modularity, technology, interfacing standards, data exchange formats, and versions.
Do not worry if you have only 20 software applications or 2000 software applications. They always fit onto an A0-sized Application Landscape Diagram. It depends on how well it is done. This step-by-step guide helps you.
How to Create an Application Landscape Diagram
An overview of the steps to take and how to create an Application Landscape Diagram is below:
- Assignment
- Think twice before creating an application landscape without an assignment (of the proper owner/client).
- Make an inventory of current top priorities and top issues (problems) with applications, together with their users. Verify if applications to them are only software or maybe also hardware.
- Show an example Application Landscape Diagram(see Figure 3) to the owner/client (the CIO) you want to get an assignment from.
- State the benefits of visualizing an application landscape, such as an overview, effective application rationalization, moving to the cloud, deduplication, managing complexity, or fewer misunderstandings with suppliers.
- Get an assignment from the owner/client (CIO) to create an AS-IS Application Landscape that is afterward used, managed, and updated.
- Communicate that you have been assigned to get sponsors and hands to help you.
- Modeling
- In what application domains, application groups, and information systems do you want to structure your application landscape, or are these already there? Decide on a taxonomy (the theoretical structure) or re-engineer your application landscape's ontology (the practical structure). How are applications decomposed into components and modules, in your opinion, or according to industry reference architectures? Are applications groups of modules, services, or functionality? Do you recognize the front, mid, and back offices? Are there information systems groups of applications? Do information domains group applications across information systems? Do applications handle business objects? Yes or No?
- It is best practice to write down and document on Dragon1 all the design decisions you make throughout the process.
- Define the sorts and types of entities that make up your application landscape: Do you work with core business applications, non-core business applications, or supporting business and office applications? And are there data-source databases and replicated-data databases?
- Create an application meta-model (what entity classes are you going to use) using a modeling language and the taxonomy or ontology in the step before.
- You could create an enterprise meta-model to relate your applications to products, processes, and hardware devices. However, focusing on applications is the most important thing now.
- Write down the business rules that should apply, such as: Every business process is supported by one core information system. Alternatively, all systems. Or: All financial functions should be integrated into ERP systems. Start a background collection process to inventory all current business rules and application architecture principles.
- Define every term you use on the application landscape. Create a glossary chapter or document for it.
- Data Collection - Filling up your user model
- Make interview rounds with business stakeholders, business and IT users, and administrators of applications.
- Collect information about your applications in an Excel sheet or an EA tool repository. Sometimes, you can export data from a CMDB tool.
- Decide on the attributes or properties you want to administer per application. If you have many attributes, create attribute groups and decide which (groups of) attributes only certain people have access to. A common list of attributes of applications is: Unique identifier, Product name, Functional name, Technical name, Description, TCO, End of life, End of contract, Supplier contacts, Supplier contract, Service level contract, Number of user licenses, Age, Platform, Operating system, Version, Maintenance costs, Replacement costs, Owner, Main purpose/usage, List of features, Main users, Supported business processes, Application status, Inventory status, Application architecture, Administrator, Location, Interfaces, Main modules, Justification, Application family, Application data.
- Collect status information about the applications: do they comply with standards, criteria, business rules, and application architecture principles?
- Creating a View - Setting a filter on the data in the model
- Make the visualization's context and scope clear via the data set you show. Include data on the organization and its business units in the view, resulting in a background picture that projects the application landscape. Is the landscape created for rationalization purposes or for some other showcasing? Are we showing the entire company or just a specific business unit?
- If you regard applications as service providers for groups of functionality, you should model and draw these. If you want to use the application diagram to standardize the types of interfaces or to improve working with a single source of truth, you will need to model and draw the kinds of interfaces, as well as the source data stored and handled in each location.
- It is best practice to collect more information (in detail and attributes) than you will show. This enables you, for instance, to report consolidated data and verify data.
- If you are making the application landscape for the CFO, be sure to include financial data; if you are making the application landscape for the CIO, include technical data; if you are making the application landscape for the COO, include processes and business continuity information.
Common Dragon1 Application Landscape views are:
- Management Overview (next to a detailed view)
- Application Modules Functions View
- Replaceable Application Modules View
- Loosely coupling view
- Dependency View (of Applications, Objects, Interfaces, and Databases)
- Applications Reuse View
- Deduplication options of Applications, Modules, and Functions View
- Obsolete & Outdated applications view (we often call this the dead tree view)
- Single Software Suppliers/Products Dependency view (where are we dependent on one supplier for solutions)
- Too Expensive Applications view
- Single Point of Failure (SPOF) view
- TCO View
- Ownership & Status view
- Software Update Maintenance view
- Users vs Licenses view
- Roles Access View
- Security Leaks view
- Architecture Principles View
- Open Standards vs Proprietary View
- Industry Standards Compliancy View
- Reference Architecture Compliancy View
- Applications Lifecycle View
- Project Impact View (With processes, applications, and technical systems)
- Business functions View per domain
- Applications functions view per domain
- Technical details view vs Functional details view
- Impact of change view (insert or remove information systems, application groups/suites, applications, modules, or application functions)
- Date time filter
- Organization specific AS-IS, Plateaus & TO-BE Views
- Single source of truth view of data & applications (overview of sources for certain business/information objects)
- Vendors / Supplier View
- Data dictionary view
- Application Service Management View *** - cases available on how applications save costs
- Visualizing - Giving a graphical representation of the data in the view
- Your application diagram should be in a version with and without issues and indicators. The first is used for strategic decision-making. The clean one is used for showing off.
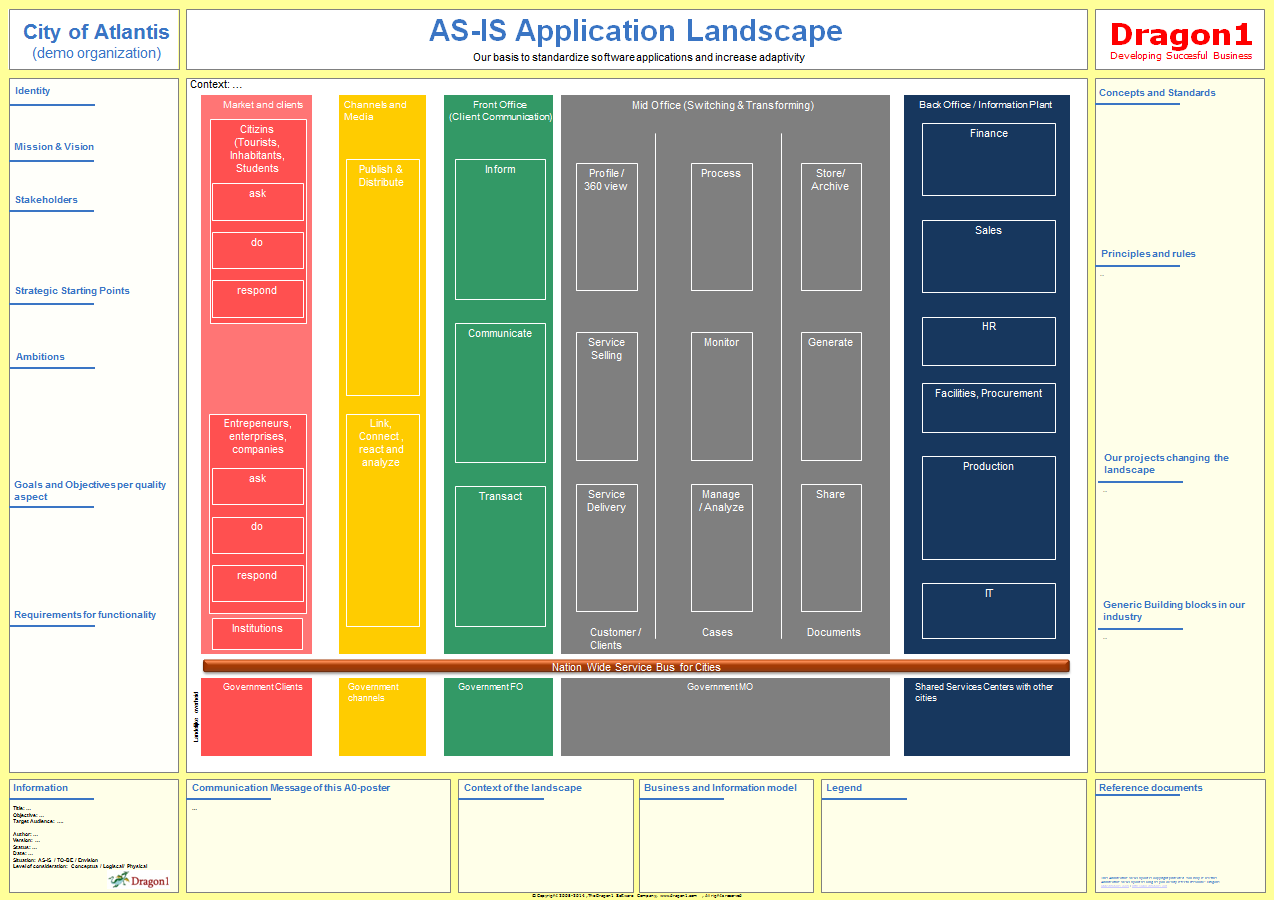
- Draw a domain view (see Figure 2) of your application landscape: link owners, managers, users, and administrators to the domains. Define and document the scope and context of the domains, including how they are currently managed or should be managed. You work mainly with domains to decomplex the landscape. Write down carefully how these domains interact with each other. How dependent are they on each other?
- Choose an optical overall pattern layout for your application landscape and a pattern layout per domain or system. Patterns include layers, bars, U-shapes, circles, random groups, and chaotic distribution. With a pattern, you immediately tell something. Compare it to a landscape map of a city. That tells you if things are organized and what solutions are workable when solving specific problems. This also goes for your application landscape. You can have a domain with applications that point to one central core application. And in other domains, you may work with a service bus.
- Make sure you have different symbol/color combinations for different technical and functional software applications. If you draw a garden, you don't draw all the plants and trees in the same shape.
- Always use a color scheme and font scheme, and check out the company policy on logos, presentations, fonts, and colors.
- Know that objects placed close to each other will seem to belong to each other. Work with repetition, rhythm, and proportionality to create the desired optical effects.
- In Dragon1, we use a solid line to indicate that an entity is there, a dotted line to indicate an entity was there, and a dashed line to indicate an entity will be there in the future.
- A successful application diagram contains a lot of information that the owner/client knows and likes to see and does not know and does not like to see (because of the situation), making him take action immediately.
- Presenting
- Have post-its ready when presenting the application landscape. And have two versions printed: one with and one without indicators, alerts, and issues.
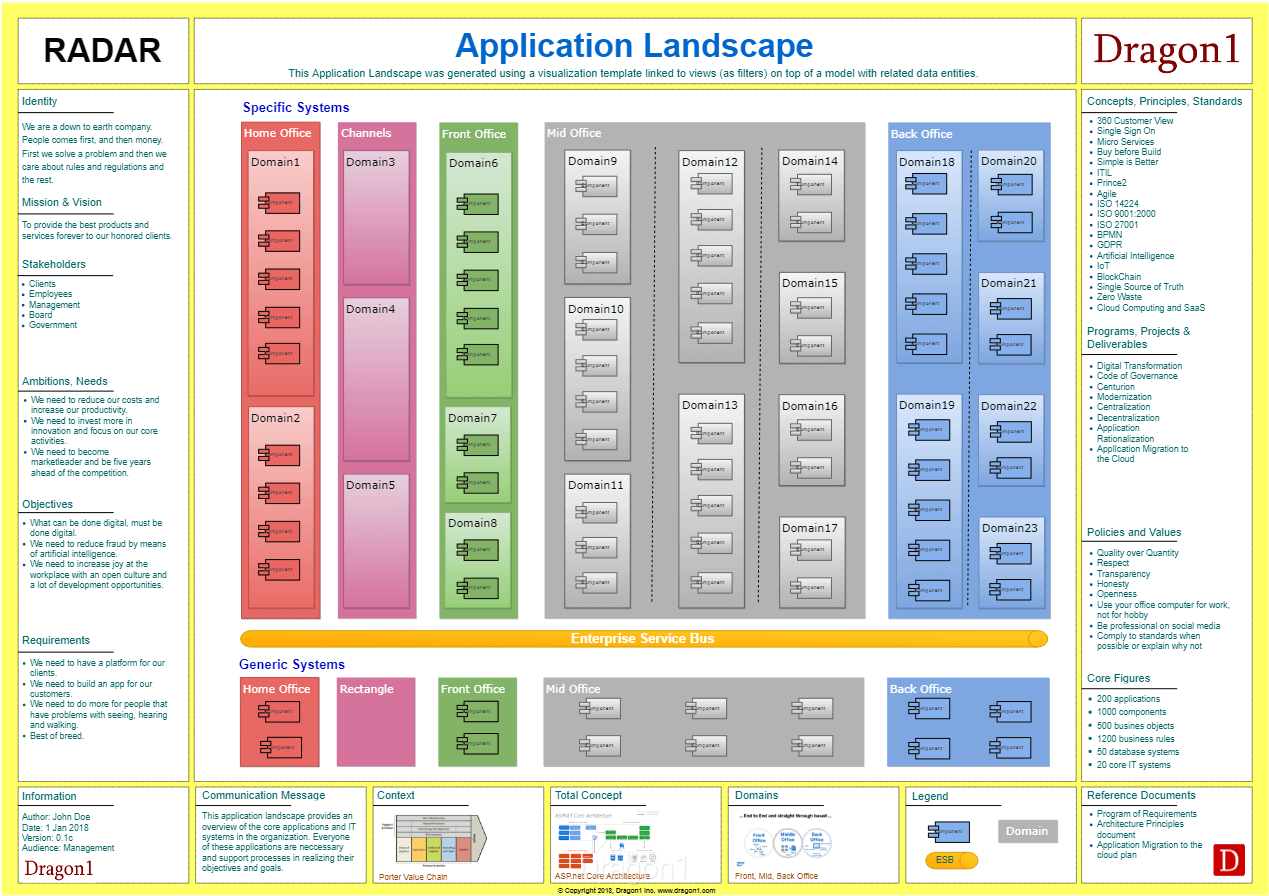
- Take the Architecture View Layout of Dragon1 (see Figure 1).
- Administration, Usage and Management
- Write down the policy for using, administration (updating), and management of the application landscape.
- Update the application landscape at least once every 3 months.
Usage
When you have your application landscape, you can use color and lines, for instance, to indicate where and what applications are not compliant with the company standards and principles, what interfacing goes wrong, or what business objective cannot be realized because of a certain situation.
You can also gray out the application landscape and only colorize the items in scope for a certain project or situation. Of course, this is all much easier to do with a specialized data visualization tool like Dragon1 than with a generic tool or basic EA Tool like PowerPoint or Archi (Open Source).
Applications Entity Classes
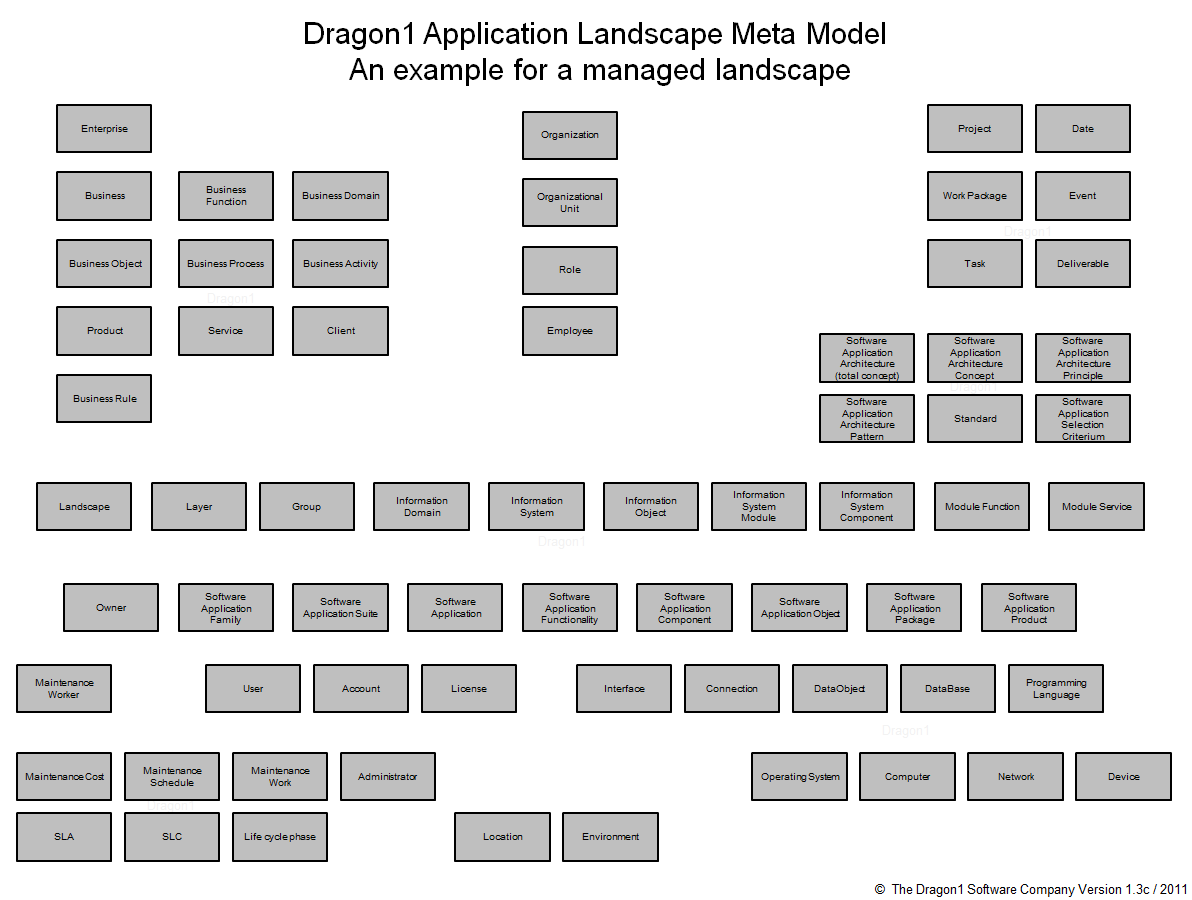
Every application landscape implicitly has a meta-model. That meta-model at least contains the following entity classes:
- software application
- information system
- application domain
- application suite
- application services
- application modules
- application components
- application objects
- application functionality
- interfacing standards
- application selection criteria
- application architecture diagram
- application architecture principles
- life cycles
- location
- environments
Everything in the application landscape needs to be uniquely identifiable. But it is important to work with a pure (meaningless) key, such as #PART0001 to #PART9999.
LoginCreate your first Application Landscape Diagram with ease. Log in or sign up for a free trial today.


