Create A System Landscape Diagram
This tutorial provides you with the essential information on how to create a system landscape diagram for management reporting.
On Dragon1, you can create static and dynamic visualizations (such as landscapes, blueprints, road maps, and diagrams). To create a static visualization, you need to draw the view you want in the Visual Designer.
In this tutorial, we will show you how to create a dynamic visualization where the color of the systems changes depending on the completion status data of the systems.
How to Create a System Landscape
To create a system landscape:
- Collect Data
- Enter Data
- Create a Model
- Create Views
- Create a Visualization Template
- Generate the System Landscape Diagram
- Add Popup Dialog Boxes
- Add Click Through Action
- Publish in the Viewer
- Export and Print
- Stakeholder Review
- See Impact of Change
The steps above are now detailed here below:
1. Collect your Data
First, define what type of decisions or insights and overview the system landscape should give.
To create a useful System Landscape, you at least need data on the projects' Domains, Systems, Project Time Lines, and Completion Status.
Now collect this data you need to enter on Dragon1: Talk with your stakeholders, export data from asset systems, and bring it all together in, for instance, a spreadsheet.
2. Enter your Data
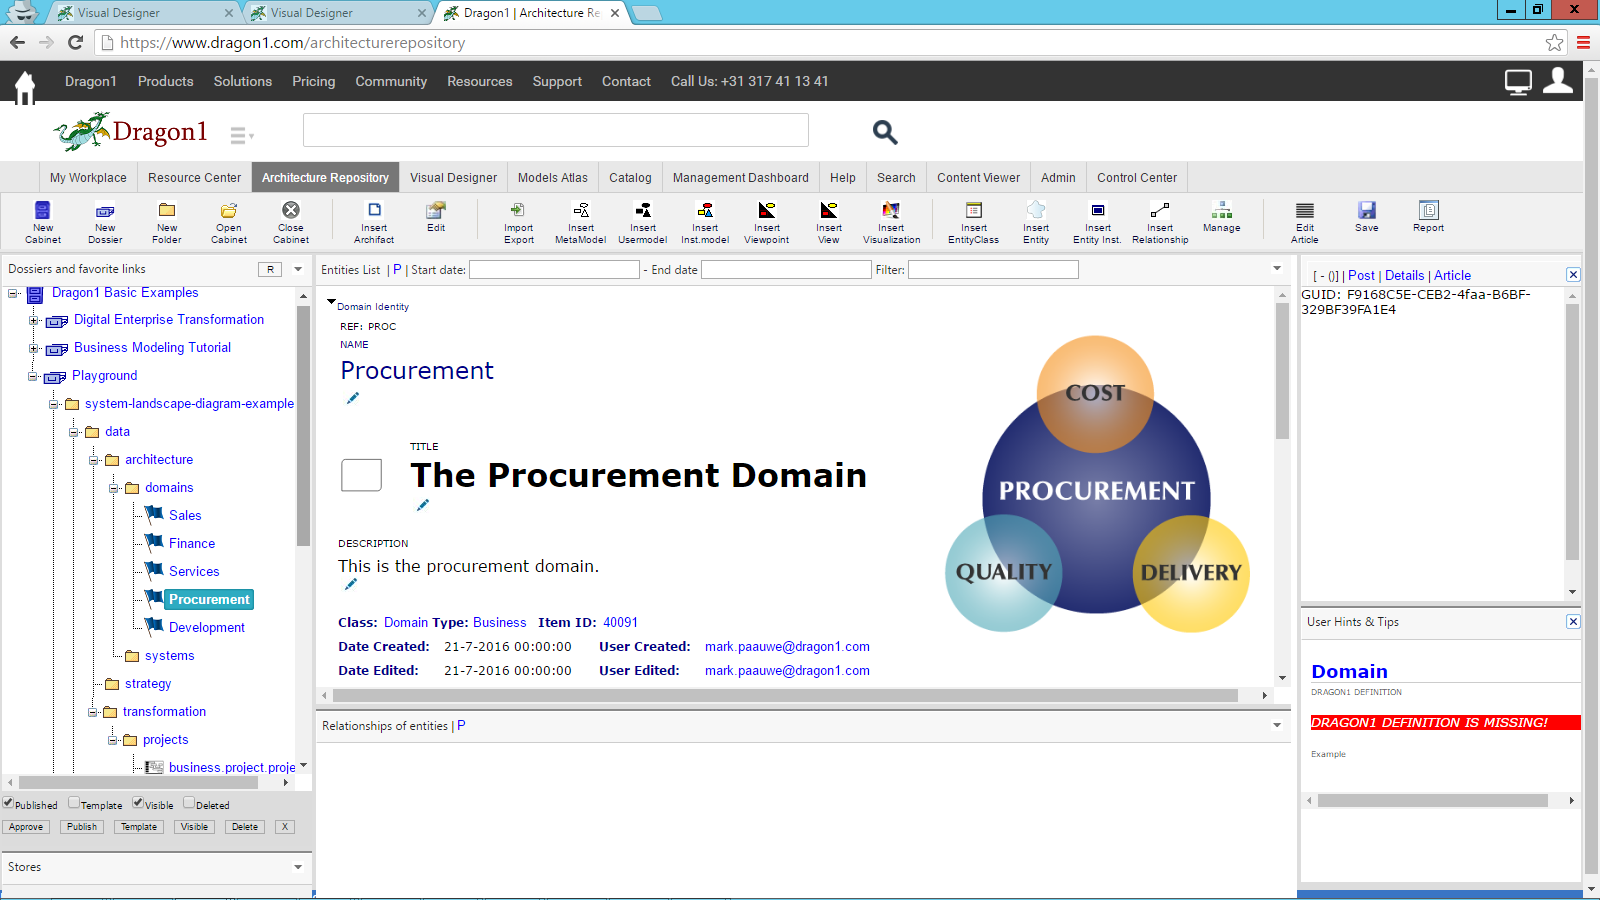
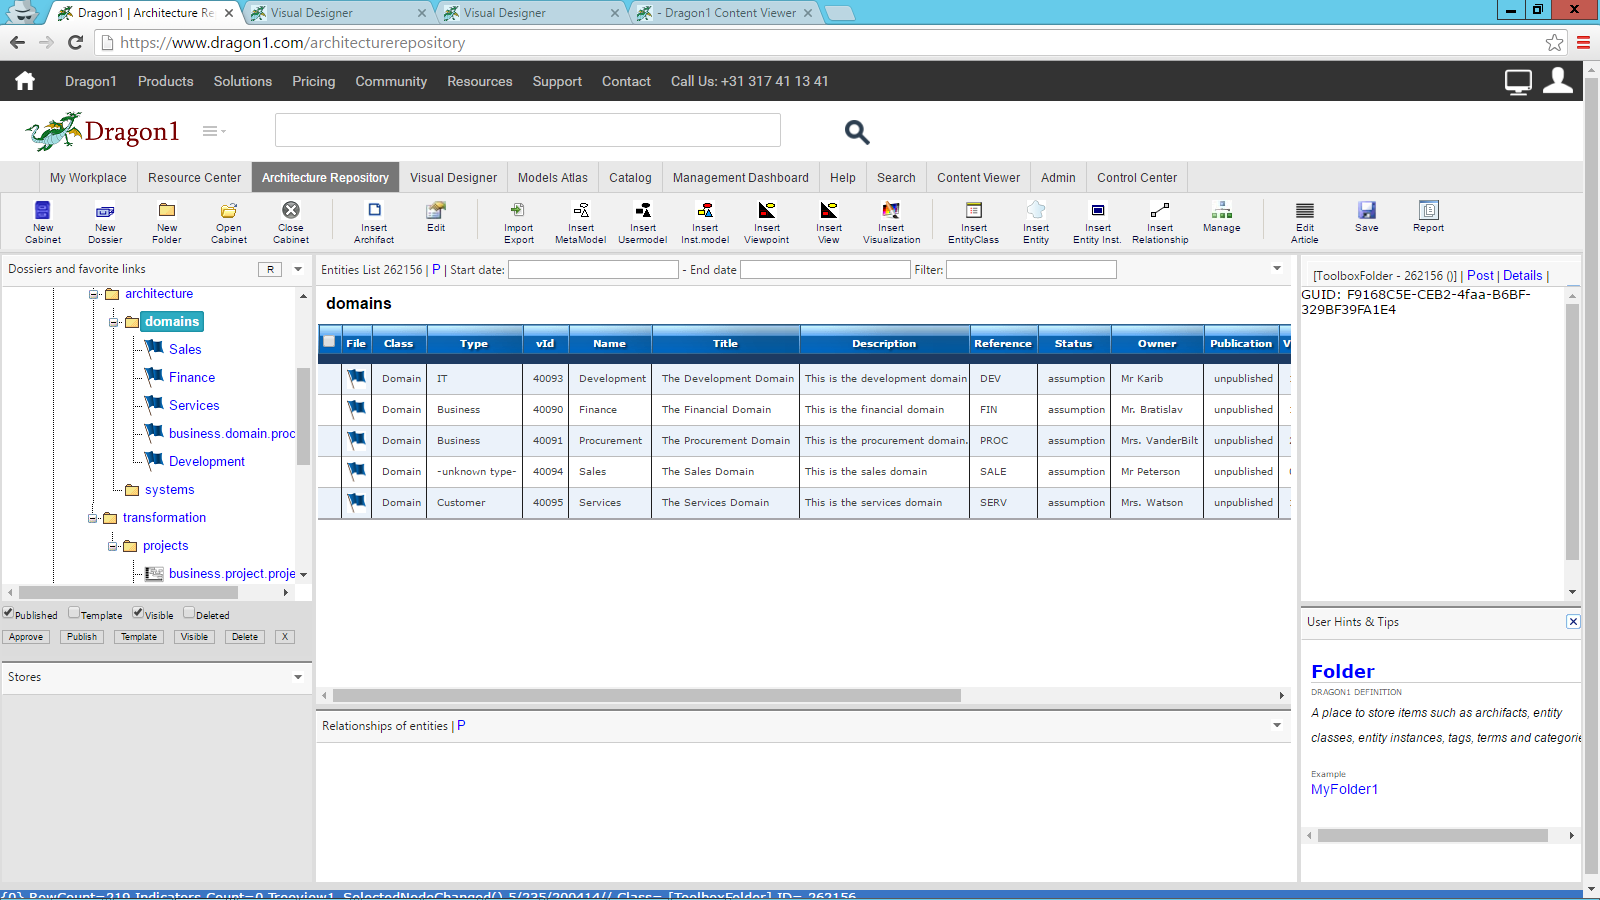
Enter your data on domains, systems, projects, and completion status in the Architecture Repository or the Visual Designer.
In the Architecture Repository, you have more control over storing data in your Cabinets (repositories). And you can enter the data manually or via the Import module.
To enter data manually:
- Startup The Architecture Repository or Visual Designer
- Create or Open a Cabinet
- Create or select a Dossier
- Create or select a Folder
- Click an entity in the Insert Entity or Draw Entity Drop down menu
- In the Visual Designer: Click Edit in the Button Bar to get the New Edit Dialog for the inserted entity. In the Architecture Repository, it will automatically appear after clicking Insert.
- Enter a name, title, and description on the Identity TAB in the New Edit Dialog. Optionally, enter a bitmap image in the information tab. Click OK.
Take a look by logging in. Go to the Visual Designer, click on Open a Cabinet, and click for an example of the entered data.
3. Create a Model
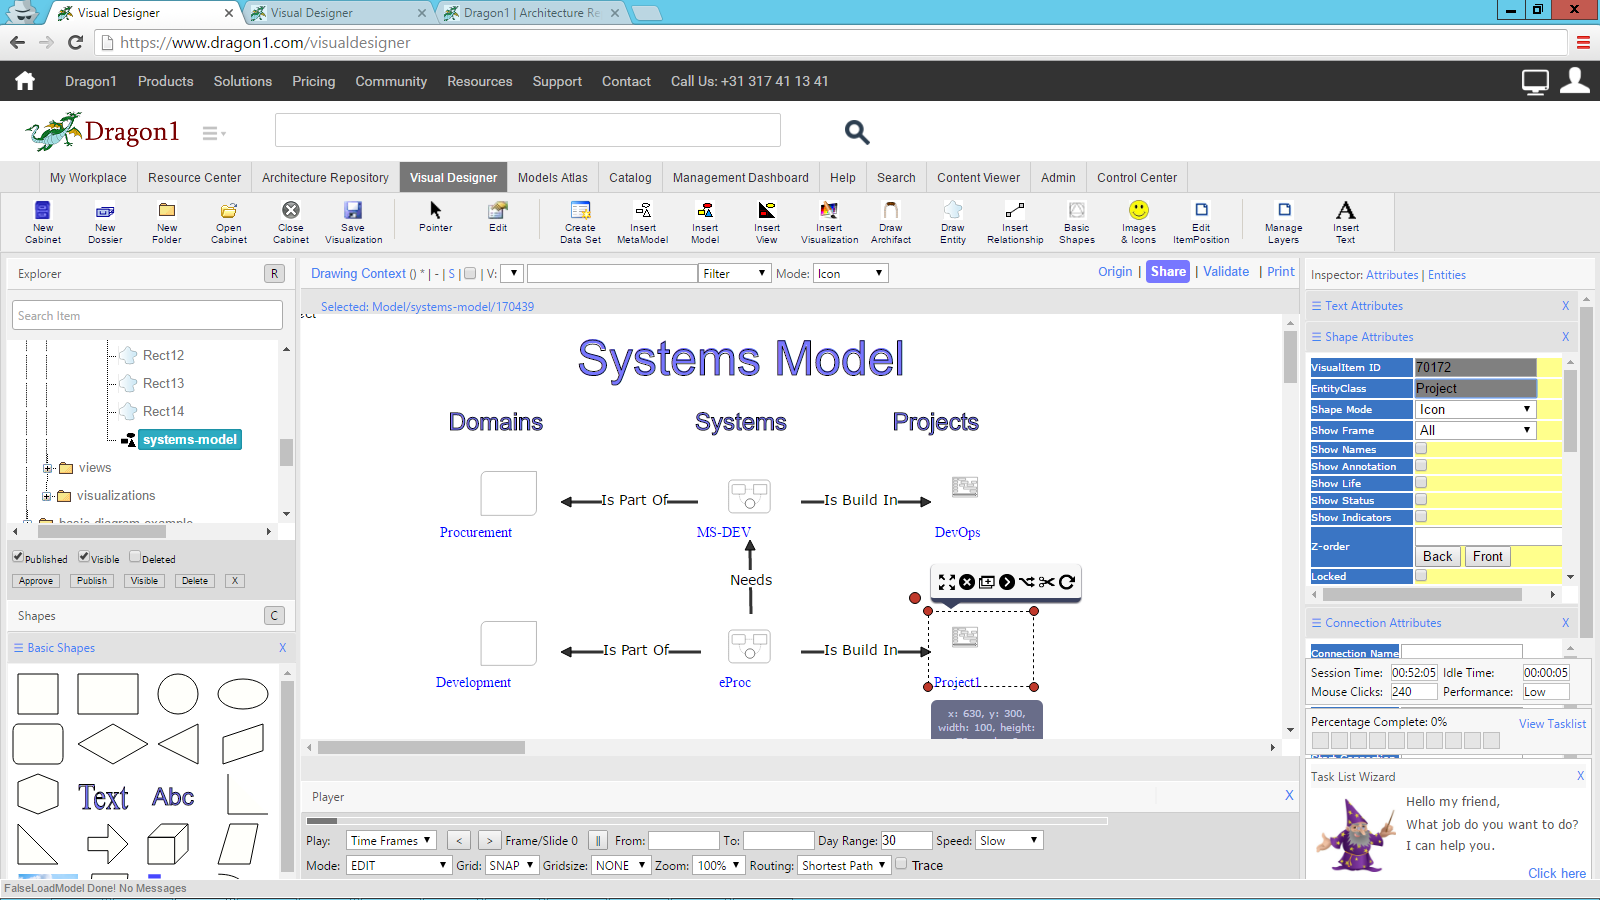
Later, we want to create a visualization that gives insights and an overview based on data and relationships. We have to create these relationships first. A model is a set of related entities, so we first have to create a model.
To create a model using the data entered:
- Startup the Visual Designer
- Open the Cabinet with your data in it
- Create a folder for the model
- Click Insert Model on the Button Bar
- You see the model added in the Explorer Treeview
- Select the model and click Edit in the Button Bar
- Give a name to the model and title, description and image. Click OK
- Keep the Model selected and go to the folders where you have entered your data (by expanding only, not selecting the folder or items).
- Now Drag every entity from the treeview onto your canvas. The application will say that the entity has been added to the model every time.
- Optionally add elements like a title or other things to the model. Drag the Abc shape from the left bottom panel to place text on your model canvas.
- If you select a shape on the canvas, you will see the smart tools. Select the connection drawing tool and draw a connection from one shape to another.
- To add text to the connection, click the black wheel when hovering over a connection. Next, go to the Inspector, expand the Connection Attributes panel, enter text in the Connection Text field, and press TAB.
- Save your model and create a new version regularly.
- If you change the publication status of the model to published in the New Edit Dialog, colleagues can collaborate with you on the model.
4. Create Views
If you have one model with several classes of entities, like domain, stakeholder, process, and application, you can already create many different views from that model.
For instance, a view with only the stakeholders, the processes, and the applications, or per domain, a view with the stakeholder, processes, and applications for that view.
To create a view:
- Go to the Visual Designer
- Select a folder
- Insert a view
- Give the view a name and click OK
- Select the view in the Explorer Treeview and Click the Edit button in the Button Bar
- Select the model you wish to use in the view on the Identity TAB below.
- Go to the behavior TAB
- Fill in a rule for the view like this:
- Rule Event: onload
- Rule Condition: Entityclass=*
- Rule Action: show(name)
- Click OK to save the view
- Instead of *, you can use the name of your entityclass, like: Entityclass=Process.
- If you select the view again in the Explorer, you will see it interprets the rule you configured.
5. Create a Visualization based on a Template
To create a visualization based on a template:
- Go to the Explorer Treeview
- Select a folder
- Insert a visualization
- Give the visualization a name
- Select the visualization in the Explorer Treeview. You are now looking at the canvas of the visualization.
- Select a template from the templates menu. Click for instance on 'Architecture View Layout'. Click on generate in the dialog.
- After some seconds (2 or 3), you will see the template appear.
- Now, you can visualize anything on the template or change the shapes of the template.
If you want the shapes that are shown via Visual Items to have a certain color or opacity or position because of an attribute value (like costs or owner or so), you insert another visual item for that (this visual item we call the indicator). Give the Visual Item a name containing the word indicator and configure a rule telling to have the shapes turn color on an attribute value. Naming the visual item indicator will add shapes to the canvas, but the shapes put on there by other visual items will be used. We also have the indicator as a separate visual item in the Archifact drop-down menu.
Indicators are often used to show completion status with text or colors and or dialog information.
6. Generate the System Landscape Diagram
To generate the System Landscape Diagram:
- Select the Visualization in the Explorer Treeview
- Insert a Visual Item on the Visualization Canvas
- Select the Visual Item in the Explorer Treeview
- Enter the ID of the view in the reference field. Look up the ID by doing a mouse-over of the leaf of the view in the Explorer Treeview).
- Enter the same rule as in the View on the behavior tab.
- Enter a width and height for the shapes on the Style TAB
- Click OK to save your Visual Item
- Now switch to NORMAL model or PRESENTATION mode and see how the Visual Item or the visualization shows the interpreted rule.
7. Add Popup Dialog Boxes
You can have popup boxes showing background information of the Entity classes or shapes.
To add popup boxes:
- Select a model in the Explorer Treeview
- Select a shape in the model
- Expand the Text Attributes panel
- Enter a description (at minimum) and enter an image URL
- Click OK to save the changes
- Now expand the Page Attributes panel
- Select the dialog box option 'User Info'
- Switch to NORMAL mode or PRESENTATION
- Now on mouse over a popup dialog will be generated if at least the description of the entity class in the model has been filled.
8. Add Click-Through Actions
To add a click-through action to the systems diagram landscape:
- Look up the Id of the model, view, or visualization you want to go to after clicking on a shape.
- Select a shape in the visualization
- Expand the Text Attributes panel
- Enter the Id in the Link URL field
- Save your changes to the visualization
- Switch to NORMAL model or PRESENTATION mode
- Go to a shape and click on it. If you have filled in the correct Link URL, you will be forwarded to that model, view, or visualization.
9. Publish in the Viewer
To publish the system landscape diagram in the Viewer or on a Watch page:
- Click the blue Share button in the Button Bar above the visualization canvas.
- Enter a name for the visualization and publication status public or worldwide.
- Include a channel name if you want the visualization published. If you do not choose the above option, the visualization will only be accessible in the Viewer and findable in the Search.
- Click OK to share the visualization.
- Go to the Viewer to look at your visualization.
10. Print and Export
To print and export your visualization:
- Click on the Print link in the Canvas Toolbar.
- Click the right mouse button to get a print menu from the browser.
- Choose Print
- In the print menu, choose pdf to create a pdf export of the visualization
- Choose a printer to print out the visualization.
11. Review by Stakeholder
If you want a stakeholder to review your system diagram, they only need to click on Add Comment to add a comment to the visualization. You, as a creator, can process the comments and delete them. If a stakeholder has subscribed to the visualization, they will receive an email when changes are made.
In the Viewer, there is also a button to show a dialog with the latest Updates and Changes to a visualization.
Even if you make many changes to a visualization, only one email will be sent to a person on a day for a visualization.
12. See Impact of Change
To see the impact of change in the Viewer, switch on the trace option. If you do a mouseover on a shape, the related shapes are lit up.
Try as an architect or consultant also the NEW Process Application Demo here for generating, comparing and filtering data for reporting to your management.


