Use and Edit Templates
Tailoring using Corporate Identity
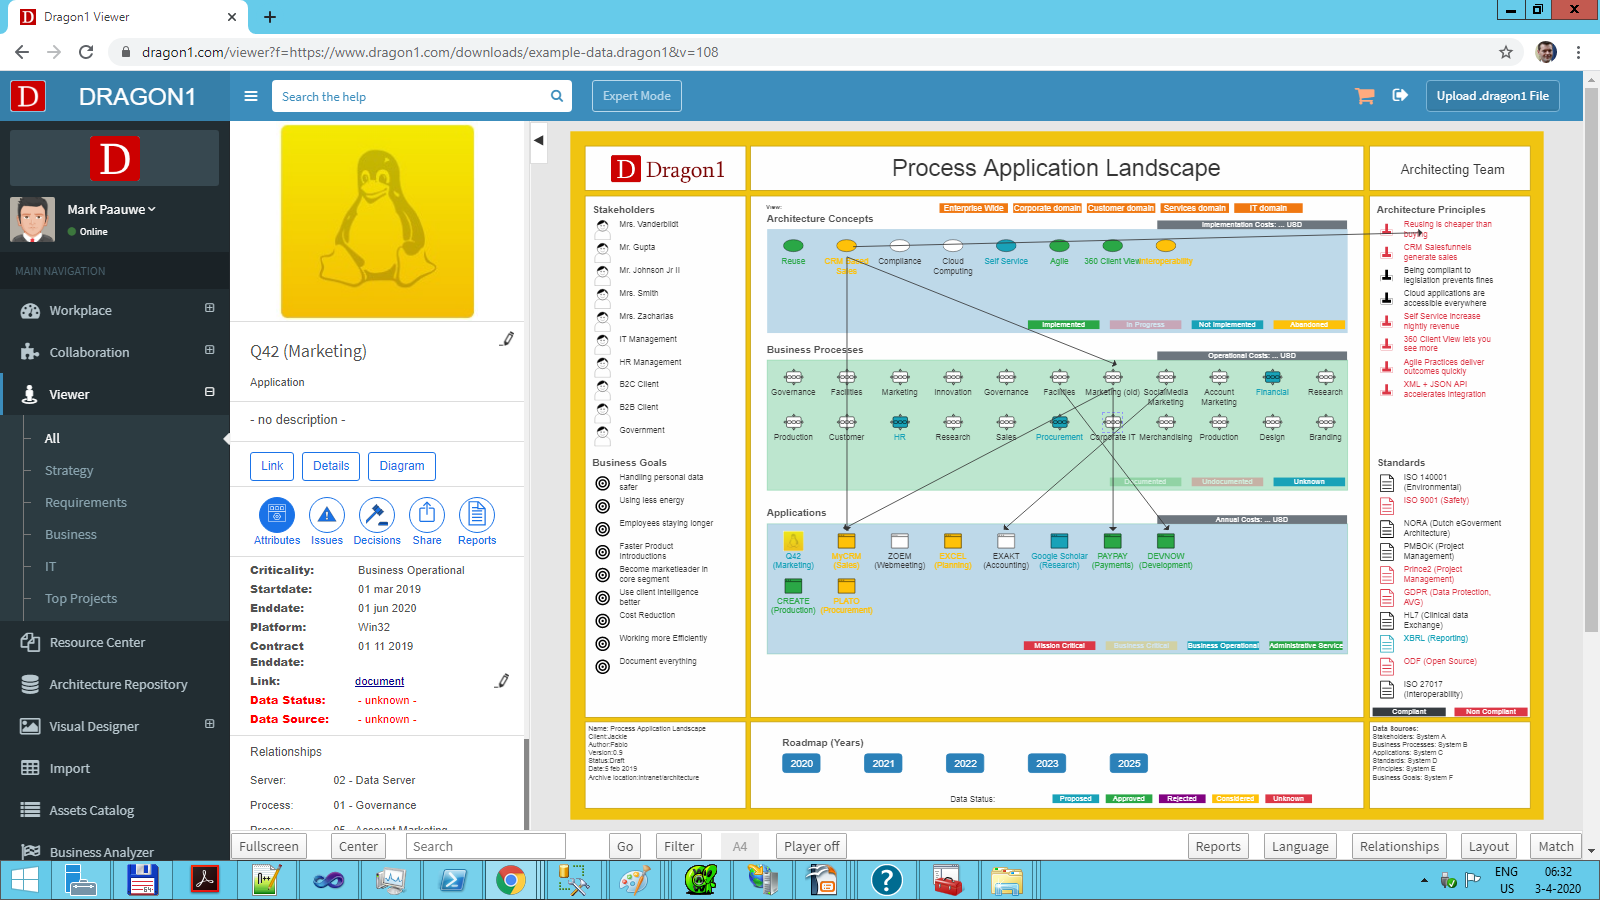
Visualizations are more appealing when they reflect the corporate identity. Dragon1 provides functionality to apply corporate identity to visualizations in minutes, utilizing colors, legends, logos, and icons.
Below is a visualization using the corporate logo and colors.
How to Use and Edit a Template?
Use the following steps to change the appearance of a visualization and apply the corporate identity to the Visualization:
- Log in.
- Click 'Collaboration' on the left side menu.
- Click 'Data Dashboard' to show the Data Dashboard.
- Click the 'Visualizations' tile to show the list of Visualizations.
- Open a Visualization by clicking it in the list.
- Click the 'Edit' button in the top button bar.
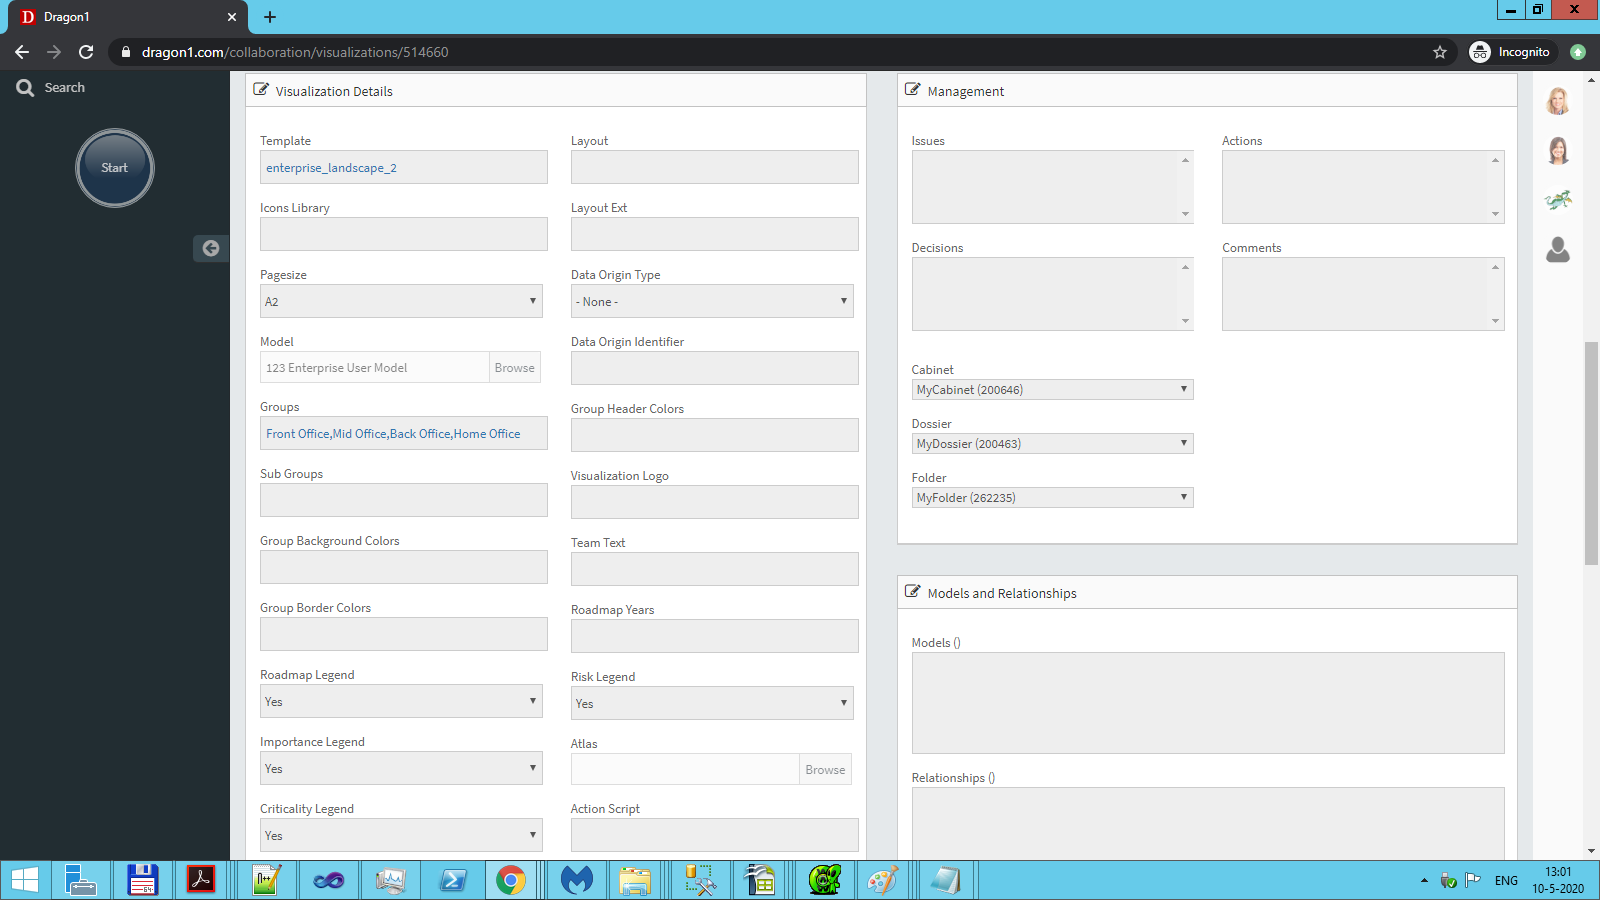
- Scroll down to see the 'Visualization Details' section.
In the 'Visualization Details' section, the corporate identity can be applied by setting the colors (group background, group border, group header), legends (roadmap, importance, risk, criticality), visualization logo, font (size and color), and icon library.
Once done:
- Press the 'Save' button to save the changes.
Changing Template Settings
Use the following instructions to change the settings of a template:
- Add UDF IconLabelWidth and provide a length between 10 or 400


