Create a Models Atlas
Note: the video is without sound or narration
Build a set of interactive visualizations to communicate architecture and solution designs
In this topic, you learn the basic steps of creating a Model Atlas in two ways: via the Viewer and the Data Manager.
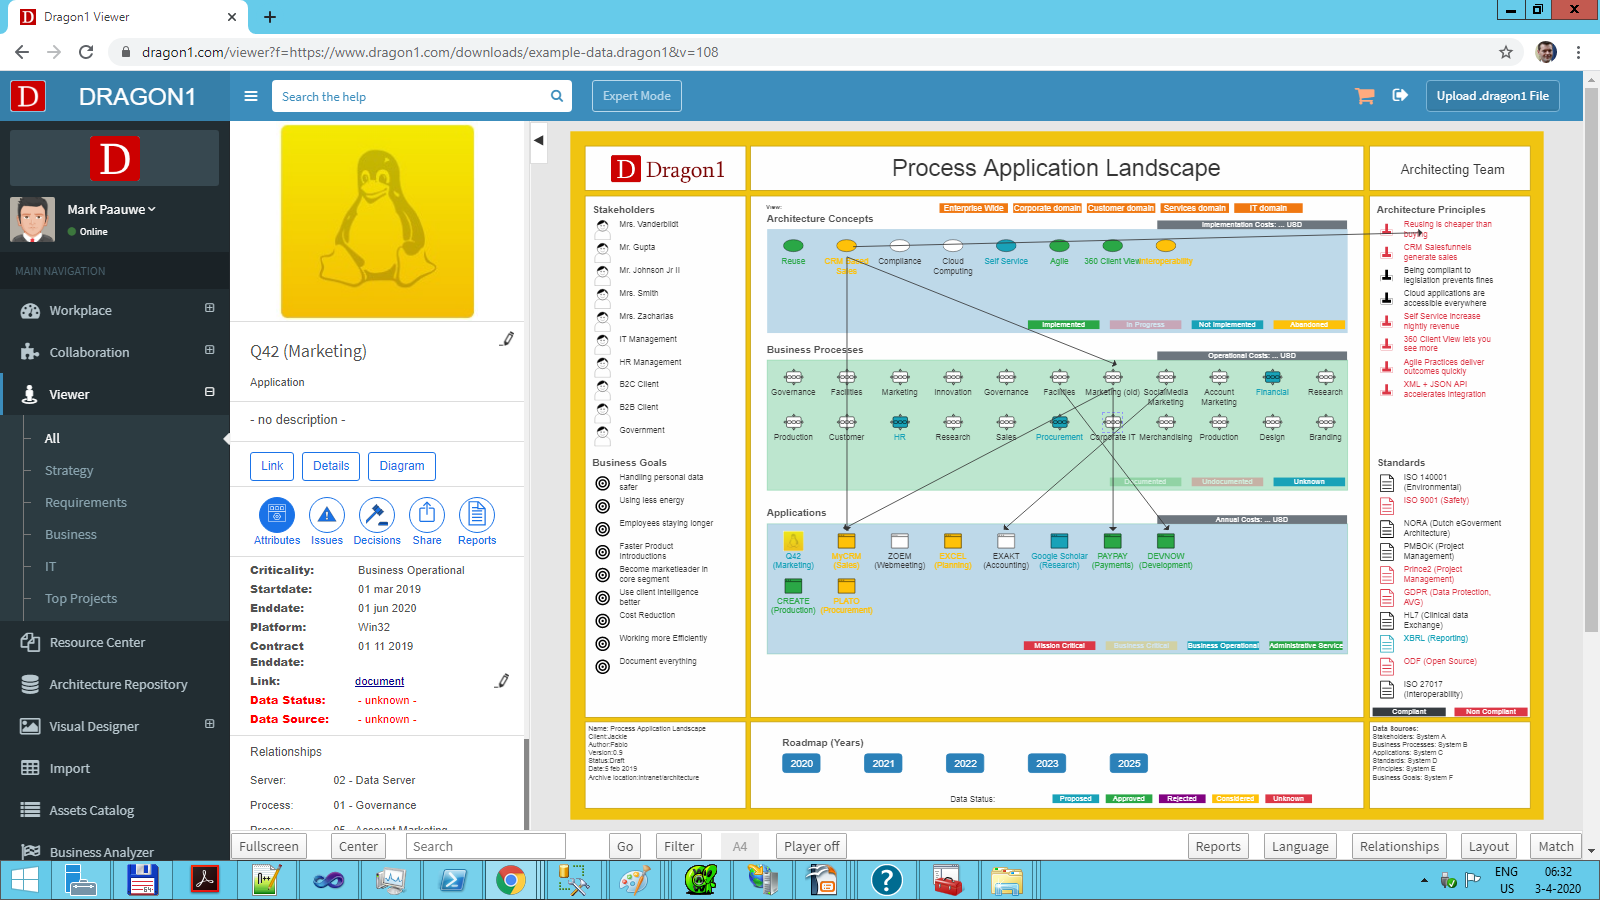
A Models Atlas is a set of pages that point to (interactive) visualizations. A published Models Atlas can be viewed in the Viewer.
With an Atlas, you can provide your stakeholders with a set of up-to-date, real-time generated, and decision-supporting visualizations (see What is an Atlas page for more information on the Dragon1 Atlas).
How To Create a Models Atlas - Via the Viewer
To create an atlas:
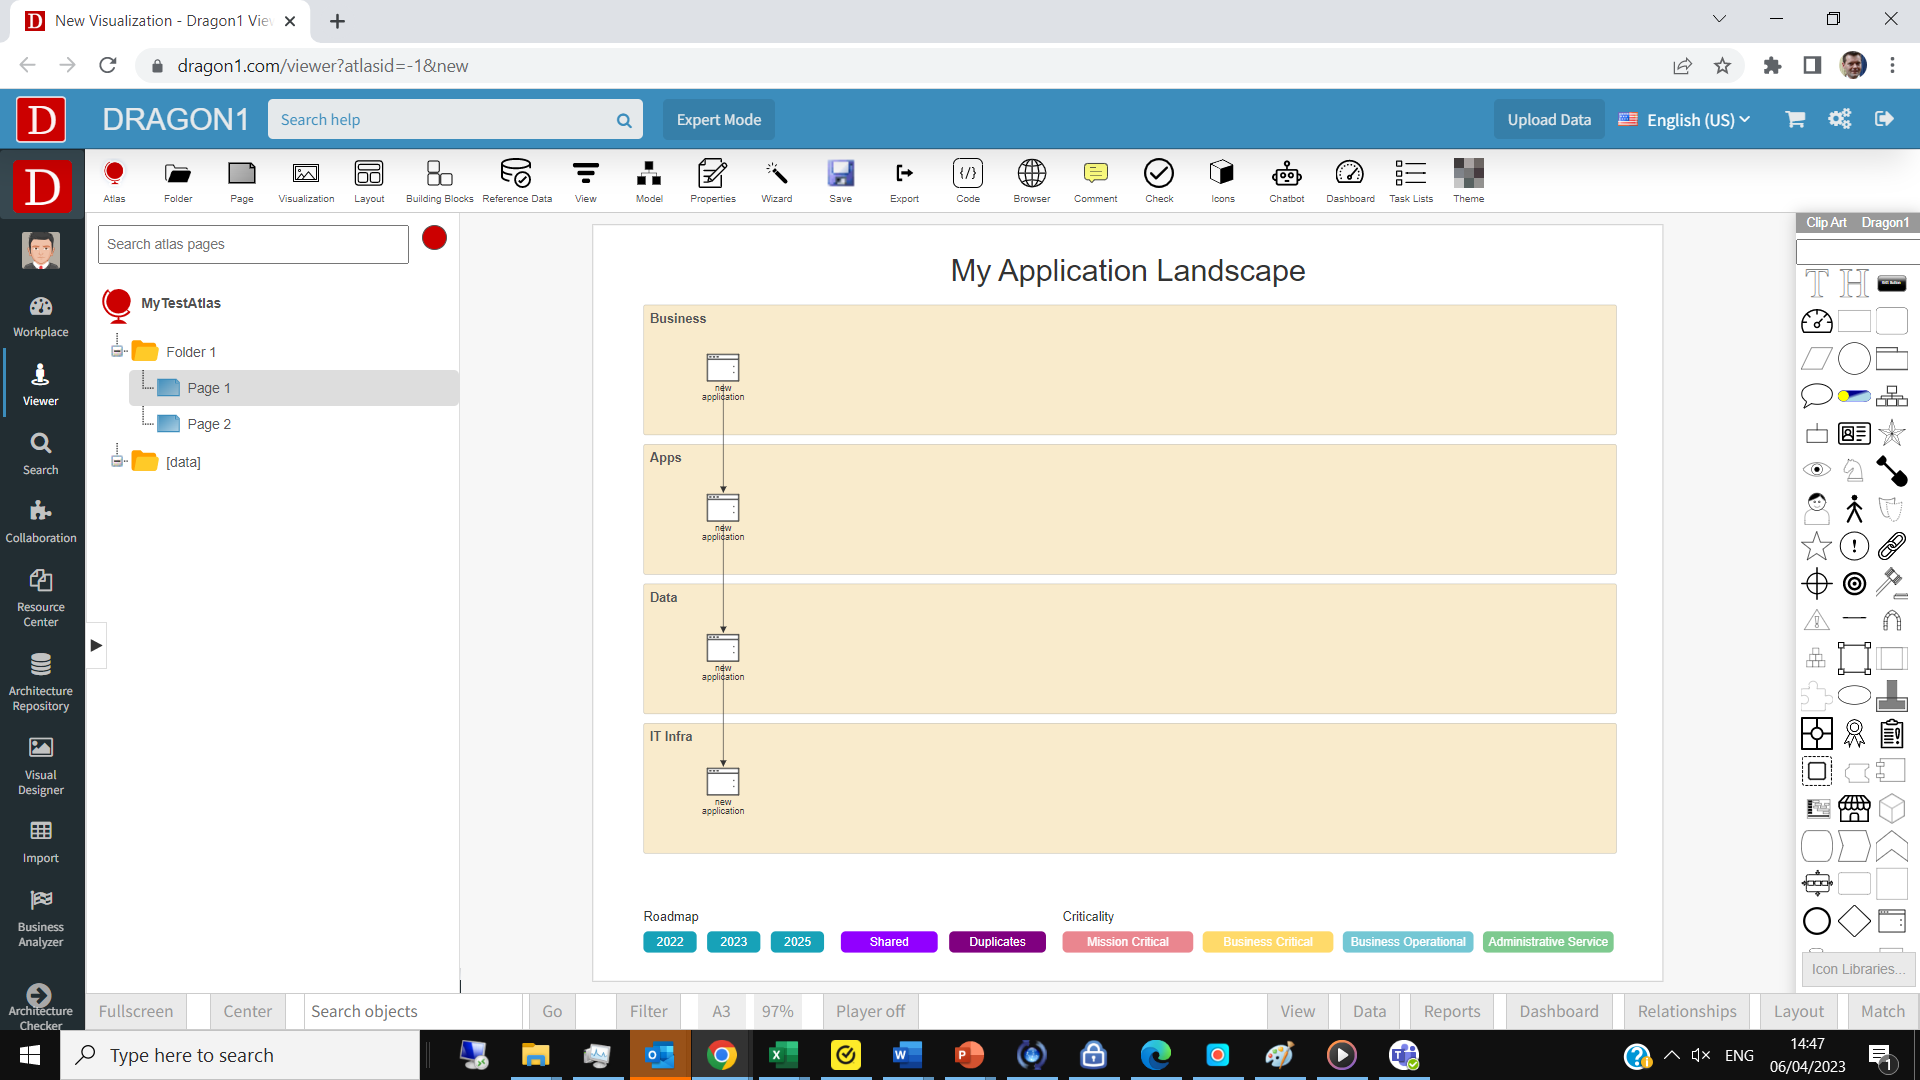
- Log in.
- Go to the Viewer via the menu.
- Click the blue plus button (Create New Atlas).
- Enter a name in the Atlas dialog and select an Atlas template.
- To store the Atlas in the repository, check the 'create in repository' checkbox.
- Click OK
You have now created an atlas.
How To Create a Models Atlas - Via the Data Manager
To create an atlas:
- Log in.
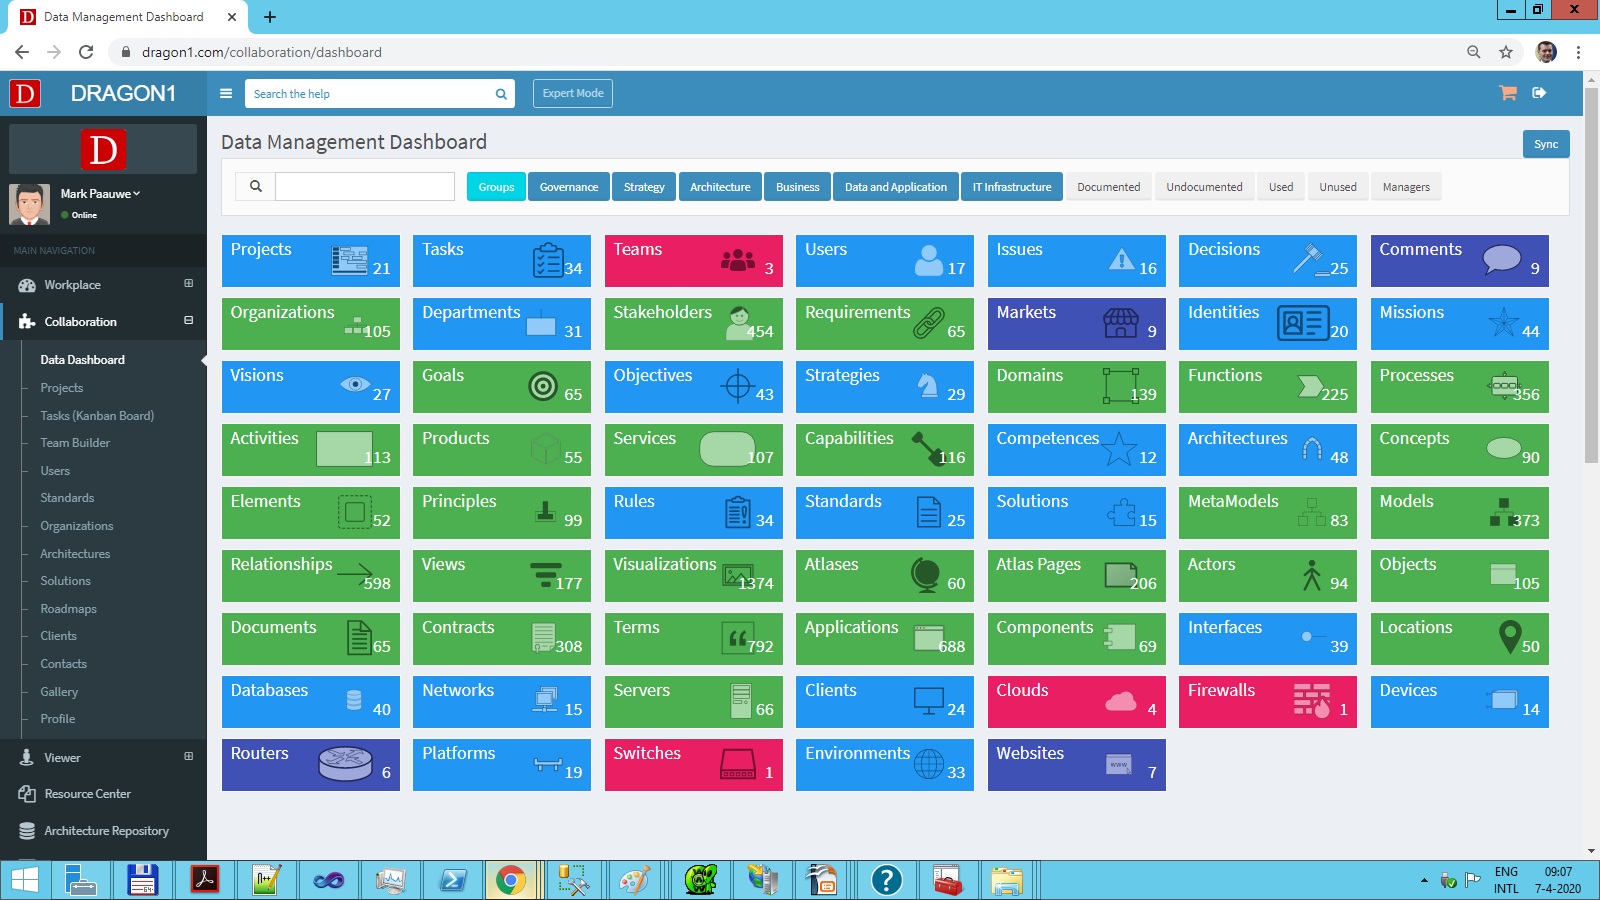
- Go to the Data Dashboard via the collaboration menu item.
- Click on the Atlases tile.
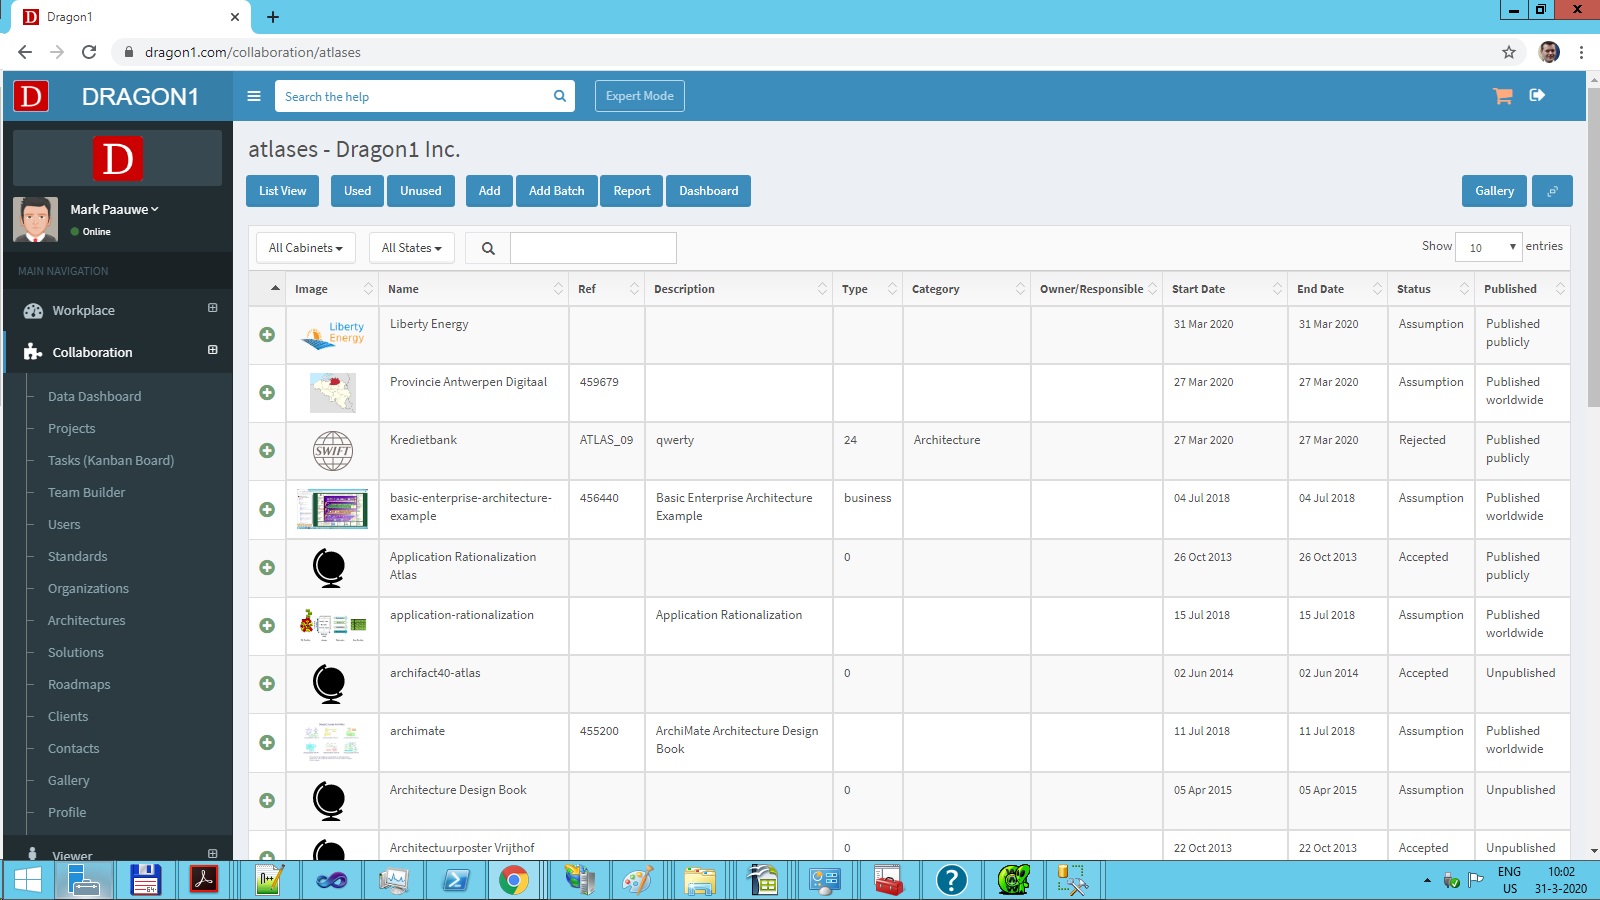
- Click on the Add button in the Atlases data list.
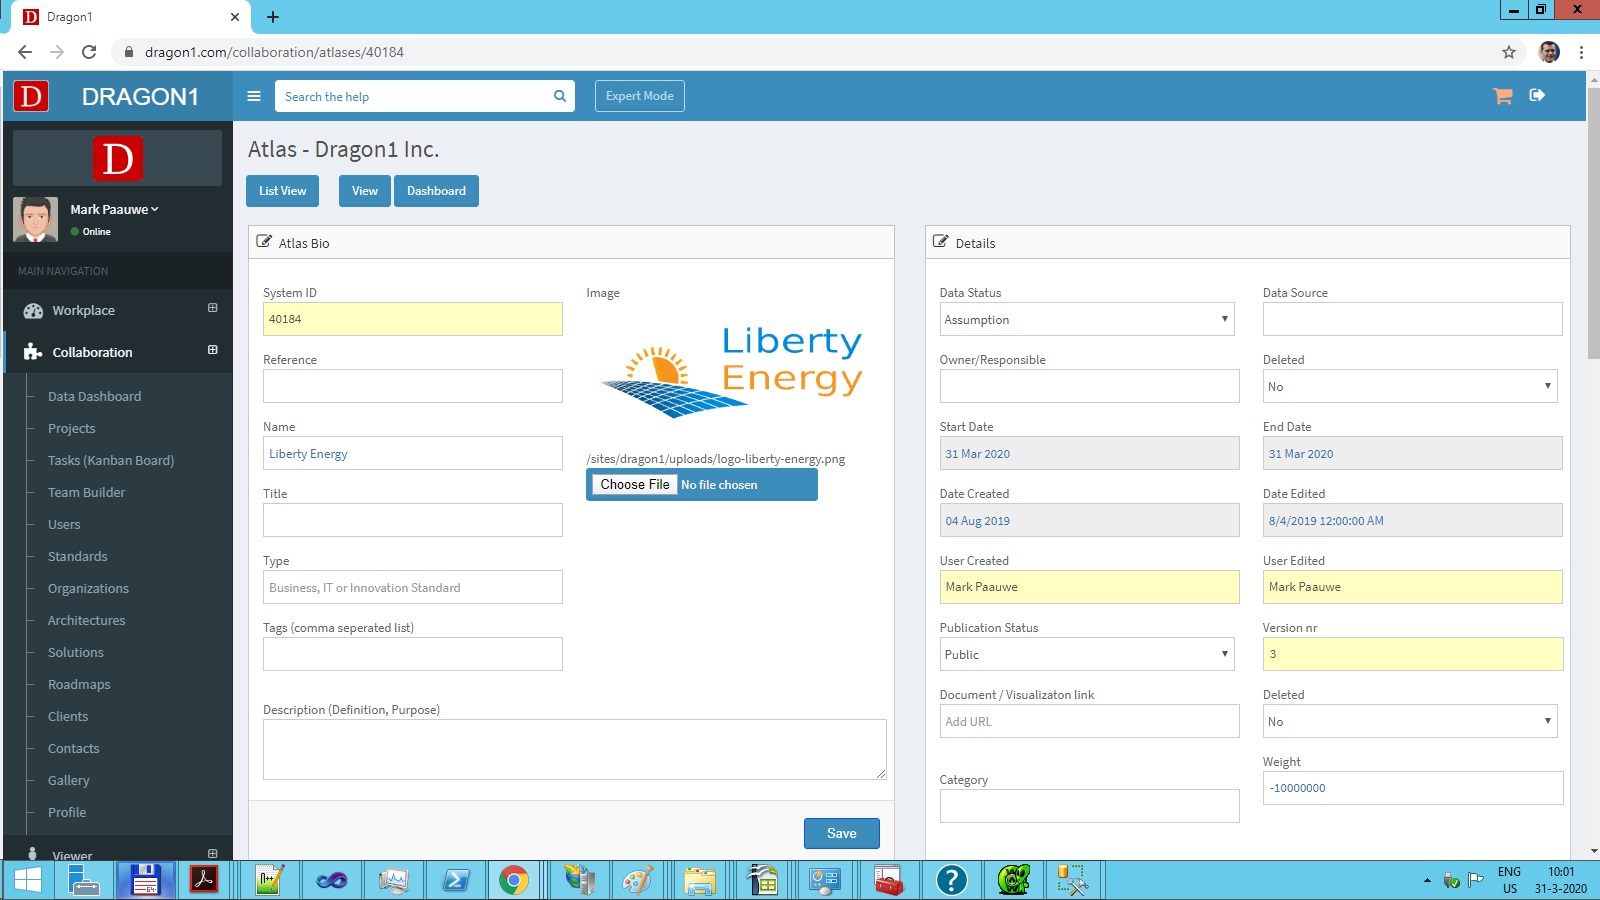
- Fill in the Atlas Details page: enter a name, upload a picture, and set publication status to published publicly. Once you do this, the Atlas is visible within your account in the Viewer.
- Click on the 'Save' button.
You must add one or more Atlas Pages to the Atlas.
To add an atlas page:
- Go to the Data Dashboard.
- Click on the atlas pages tile.
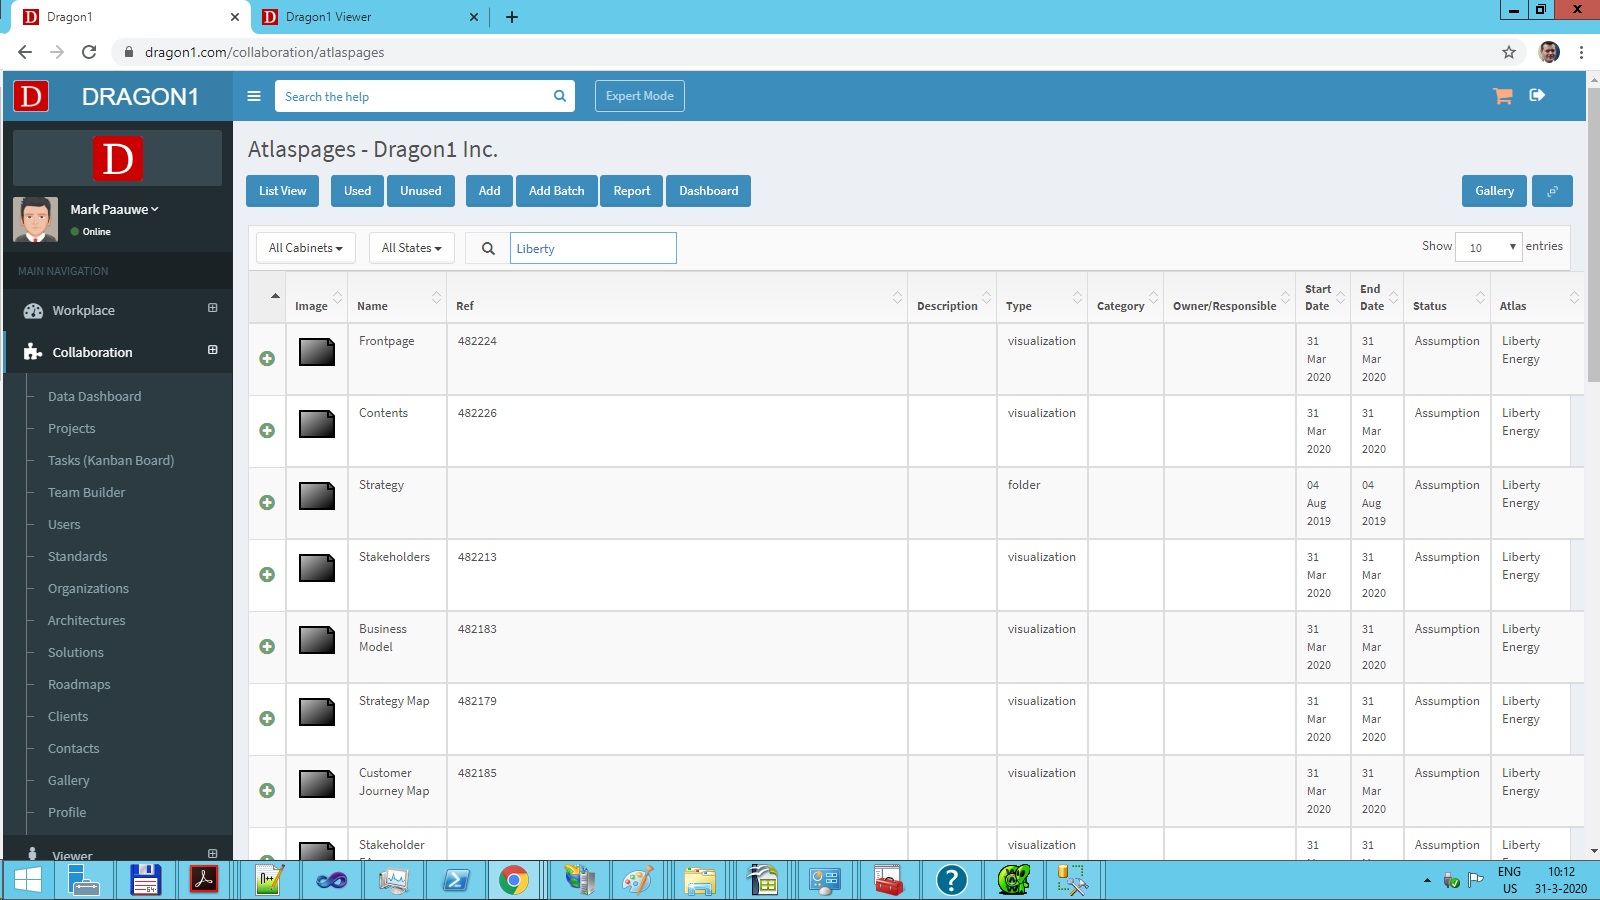
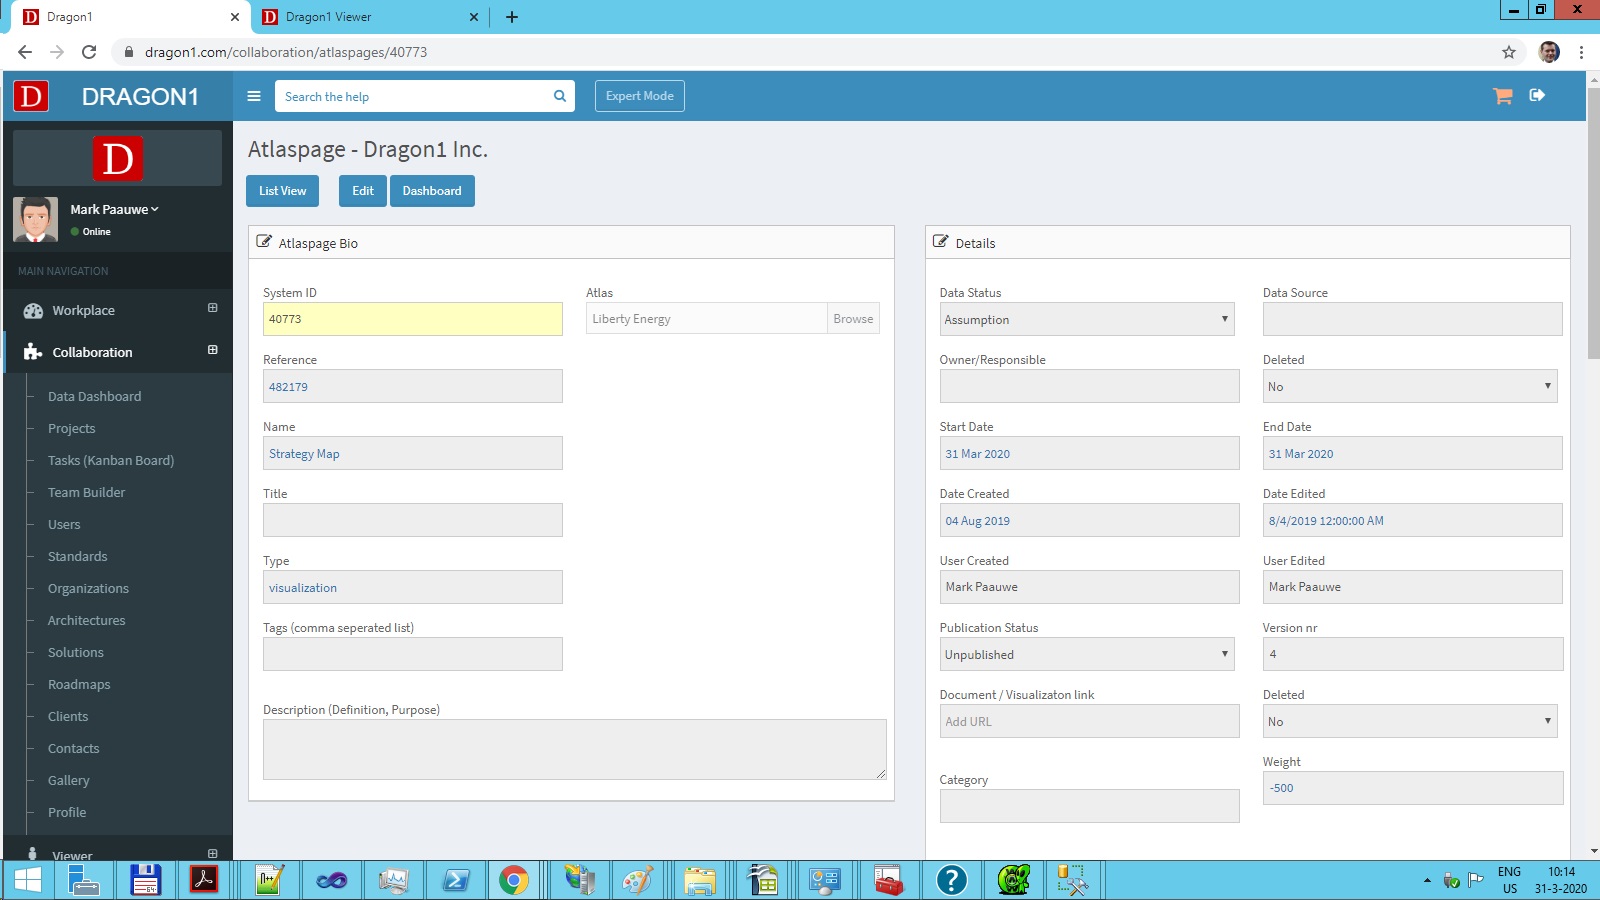
- Fill in the Atlas Page details page: enter a name and enter a type (folder or visualization). Enter a weight to decide where this page will be in the Atlas page tree menu.
- In the Visualization ID Reference field, enter the visualizationid of a visualization.
- Click on the 'Save' button.
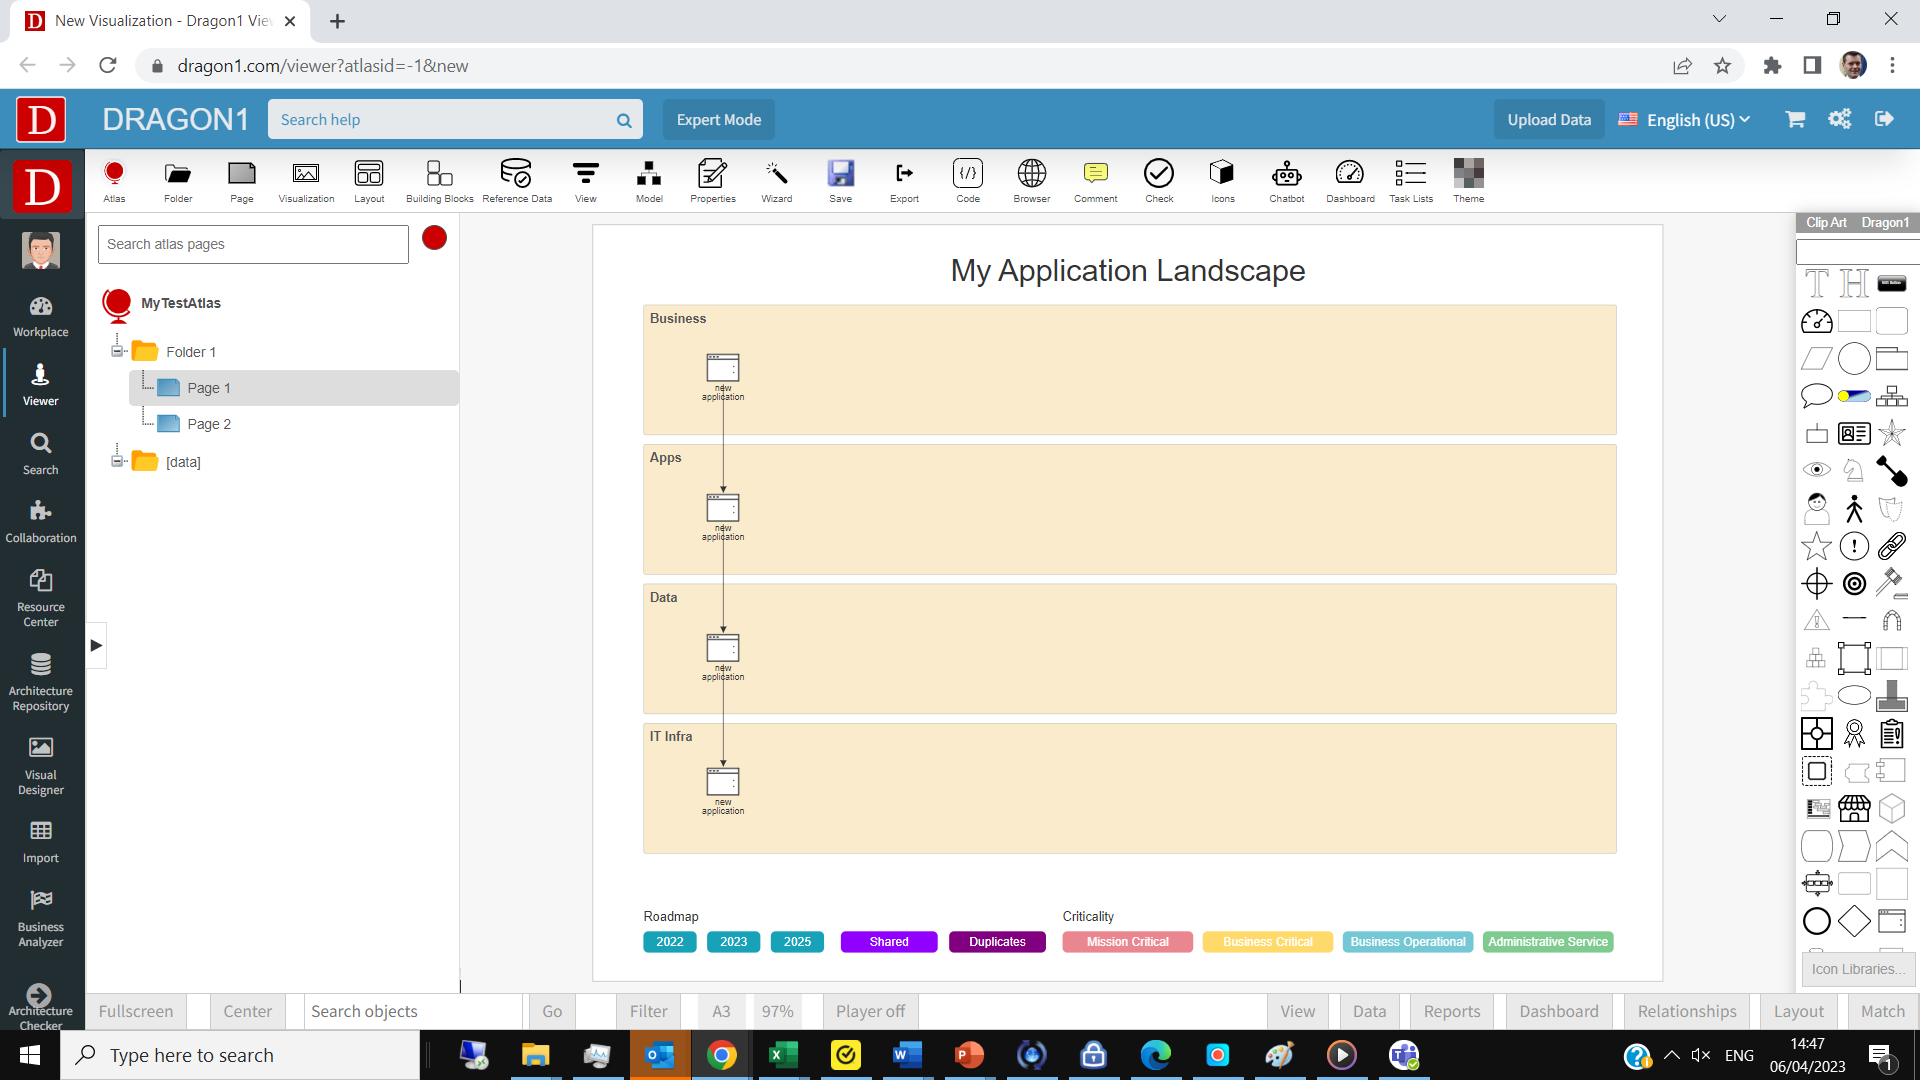
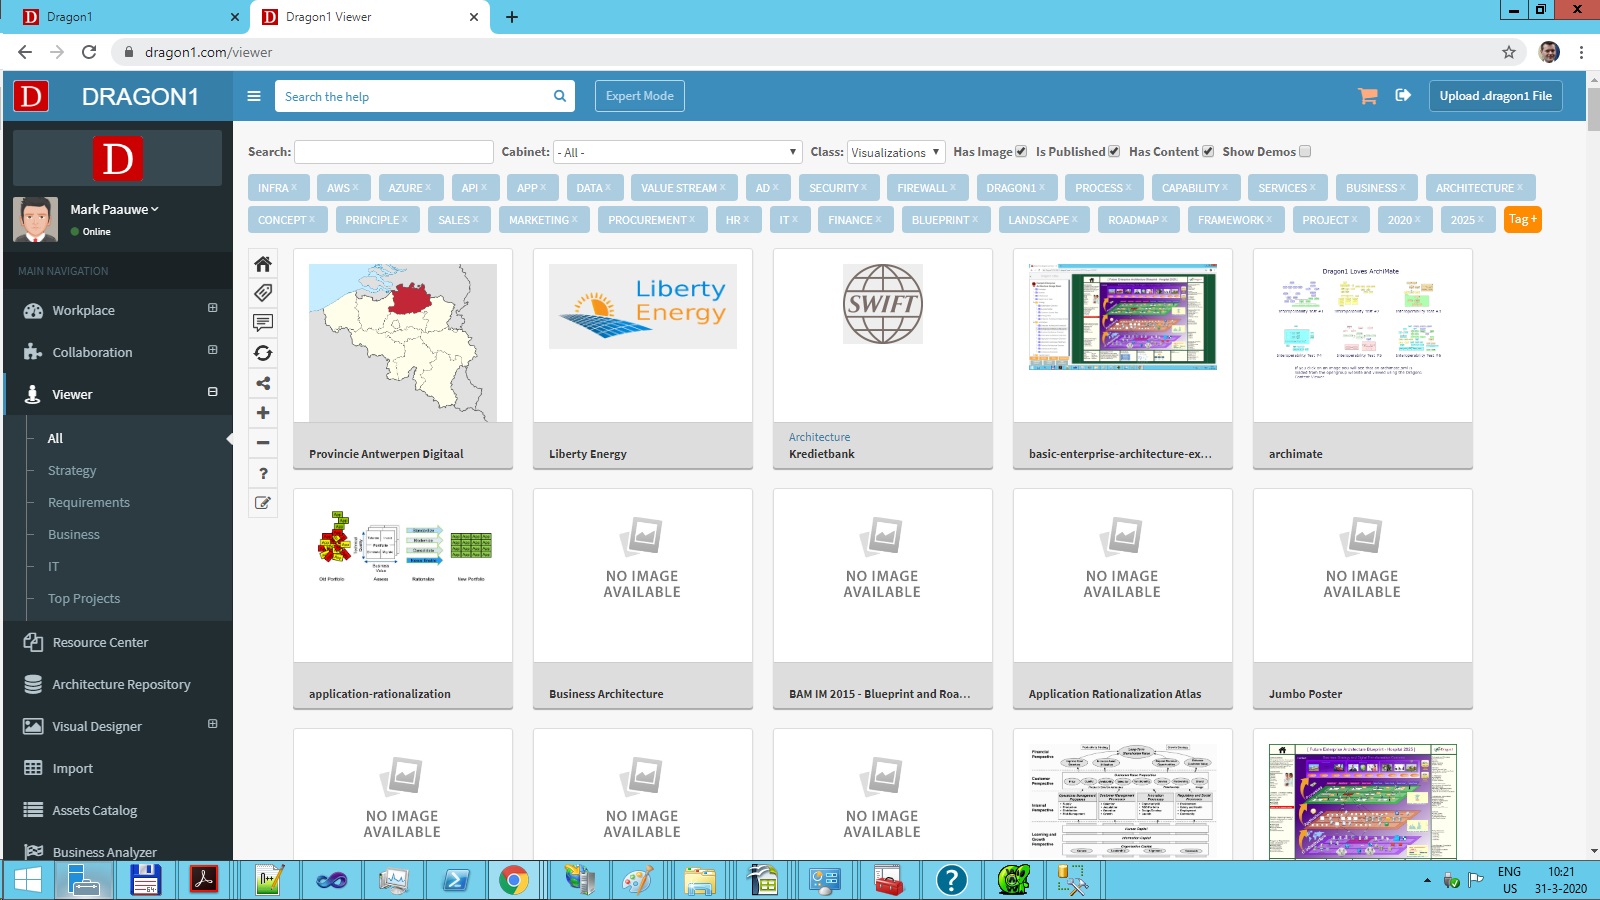
You can view the Atlas Page in the Atlas in the Viewer.
- Go to the Viewer.
- Select your Atlas by clicking on the Atlas picture.
- You see a page tree menu. Click on it to see your visualization.
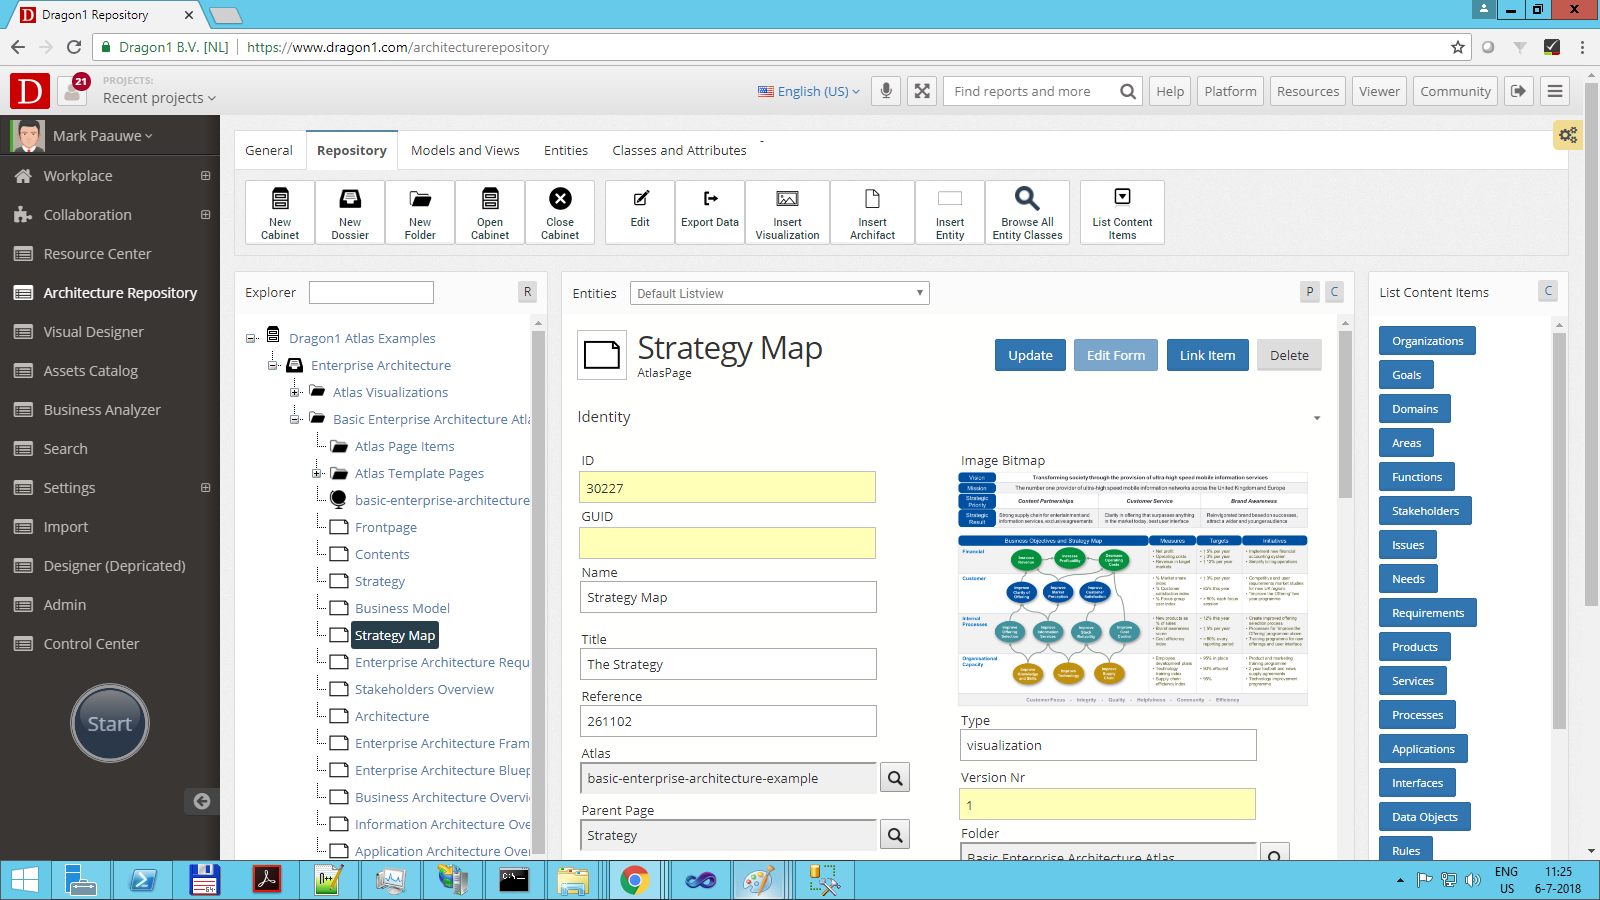
The data you entered is stored by default in MyCabinet. See the screenshot of the Architecture Repository below.
Collapsed Folders
Specify ShowTreeCollapsed in the description field or the action script field.
Below, follow the screenshots per step.
Atlas Attributes
An atlas has the following attributes that can be set:
- Name
- Title
- Descr
- Publication status
- Owner
- Classification
- Colorscheme (the colors provided here can be used as #color1#, etc...
- Margins (#margin1#, ...)
- Paddings (#padding1#, ...)
Alternative Steps to Creating a Dragon1 Atlas
Alternative steps to create an atlas are:
- Create several visualizations, static or dynamic.
- Go to the Architecture Repository.
- Open a Cabinet.
- Select a Folder.
- Insert an Atlas entity.
- Insert several Atlas Page entities.
- Link the Atlas Page entities to the Atlas entity via the Atlas attribute in the form.
- Place the id of a visualization in the reference field of the Atlas Page.
- Make sure the page is published (normally, you keep the template pages unpublished).
- Make sure the Atlas entity is published and has a picture so it shows up nicely in the Viewer overview or the Search.
Use Templates Pages
When creating your Atlas, you can streamline the process using template pages.
For instance, if you want to apply a certain color scheme, page layout, default objects, or logo on every page.
Startup Visualization in an Atlas
To have a visualization automatically be the first visualization shown in an atlas, do the following:
Place startvisualizationid=.... in the description field of the atlas.
You can find the visualizationid in the application Collaboration > Data Dashboard > Visualizations.
Or you can do a mouse over in an atlas at the front of a page name in the treeview.
Tip: Study the Example Atlas
Learning new things is often speeded up by looking at existing examples, such as the "example Dragon1 Atlas".
Visit the example Dragon1 Atlas here.
The example Atlas shows three parts or stages: Strategy, Architecture and Transformation.
The idea is that an organization first has stakeholders who require changes to the company because of the strategy and a new business model.
The architects create this part of the Atlas in iterations and interaction with the stakeholders.
Next, they design the architecture in line with the strategy and business model and interactively with the stakeholders in iterations. Also, a process diagram is used here to communicate how people can effectively use architecture artifacts (products).
Finally, the architects add information showing how the projects could or should use the principles and standards coming from the architectures.
Note: You can have any page structure in the Atlas.


