How to Create an Architecture Layers Map
Provide Landscape Transparency
This tutorial first discusses three ways to model visualizations with views into an architecture atlas.
Next, it shows how stakeholders in the Viewer can access it, providing landscape transparency on all enterprise architecture layers.
FSwin-USA is a fictitious (non-existing) example company in financial services.
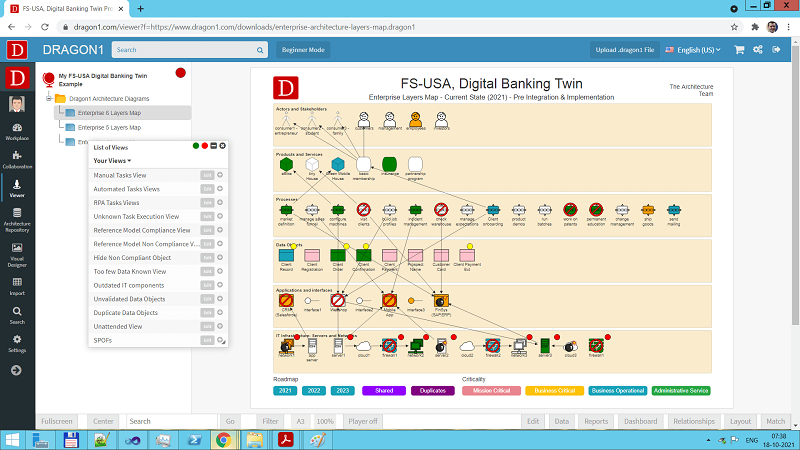
The main diagram in the FSwin-USA shows six layers. A layer for stakeholders, services, processes, data, applications, and IT infrastructure components.
Per layer, the key objects and components are shown as dependencies across layers.
As you probably already know, the clearer it is to everyone how everything is connected and how well everything is or is not compliant with principles, standards, and rules, the better things can be planned and improved.
Therefore, creating a diagram that gives this insight and overview is a good and smart thing.
Enterprise architecture is a tool for planning business and IT changes, strategy, and business model transformation, and managing the risks accordingly.
This tutorial first discusses three ways to model visualizations with views into an architecture atlas.
Next, it shows how stakeholders in the Viewer can access it.
At the end, the steps on creating an architecture layers map yourself are provided.
Mapping the FSwin-USA Strategy
FSwin-USA is a fictitious financial services company.
To stay ahead of the competition, they decided to significantly change and improve how they do customer contact, process payments, and enable clients to make digital payments.
They identified three business capabilities that should be implemented:
- Customer Terms Contact - the client decides how we contact them
- Payment Processing and Mediation -
- Digital Micro Payments - Banking clients can do real-time micro-payments (less than USD 10) with an exact cost of 1 USD cent.
The CEO is very impatient and wants to implement these capabilities within 3 months and all at once!
As this impacts everything in the organization, it was decided to create an architecture atlas with the following three diagrams:
- Current State Enterprise Architecture
- Future State Enterprise Architecture
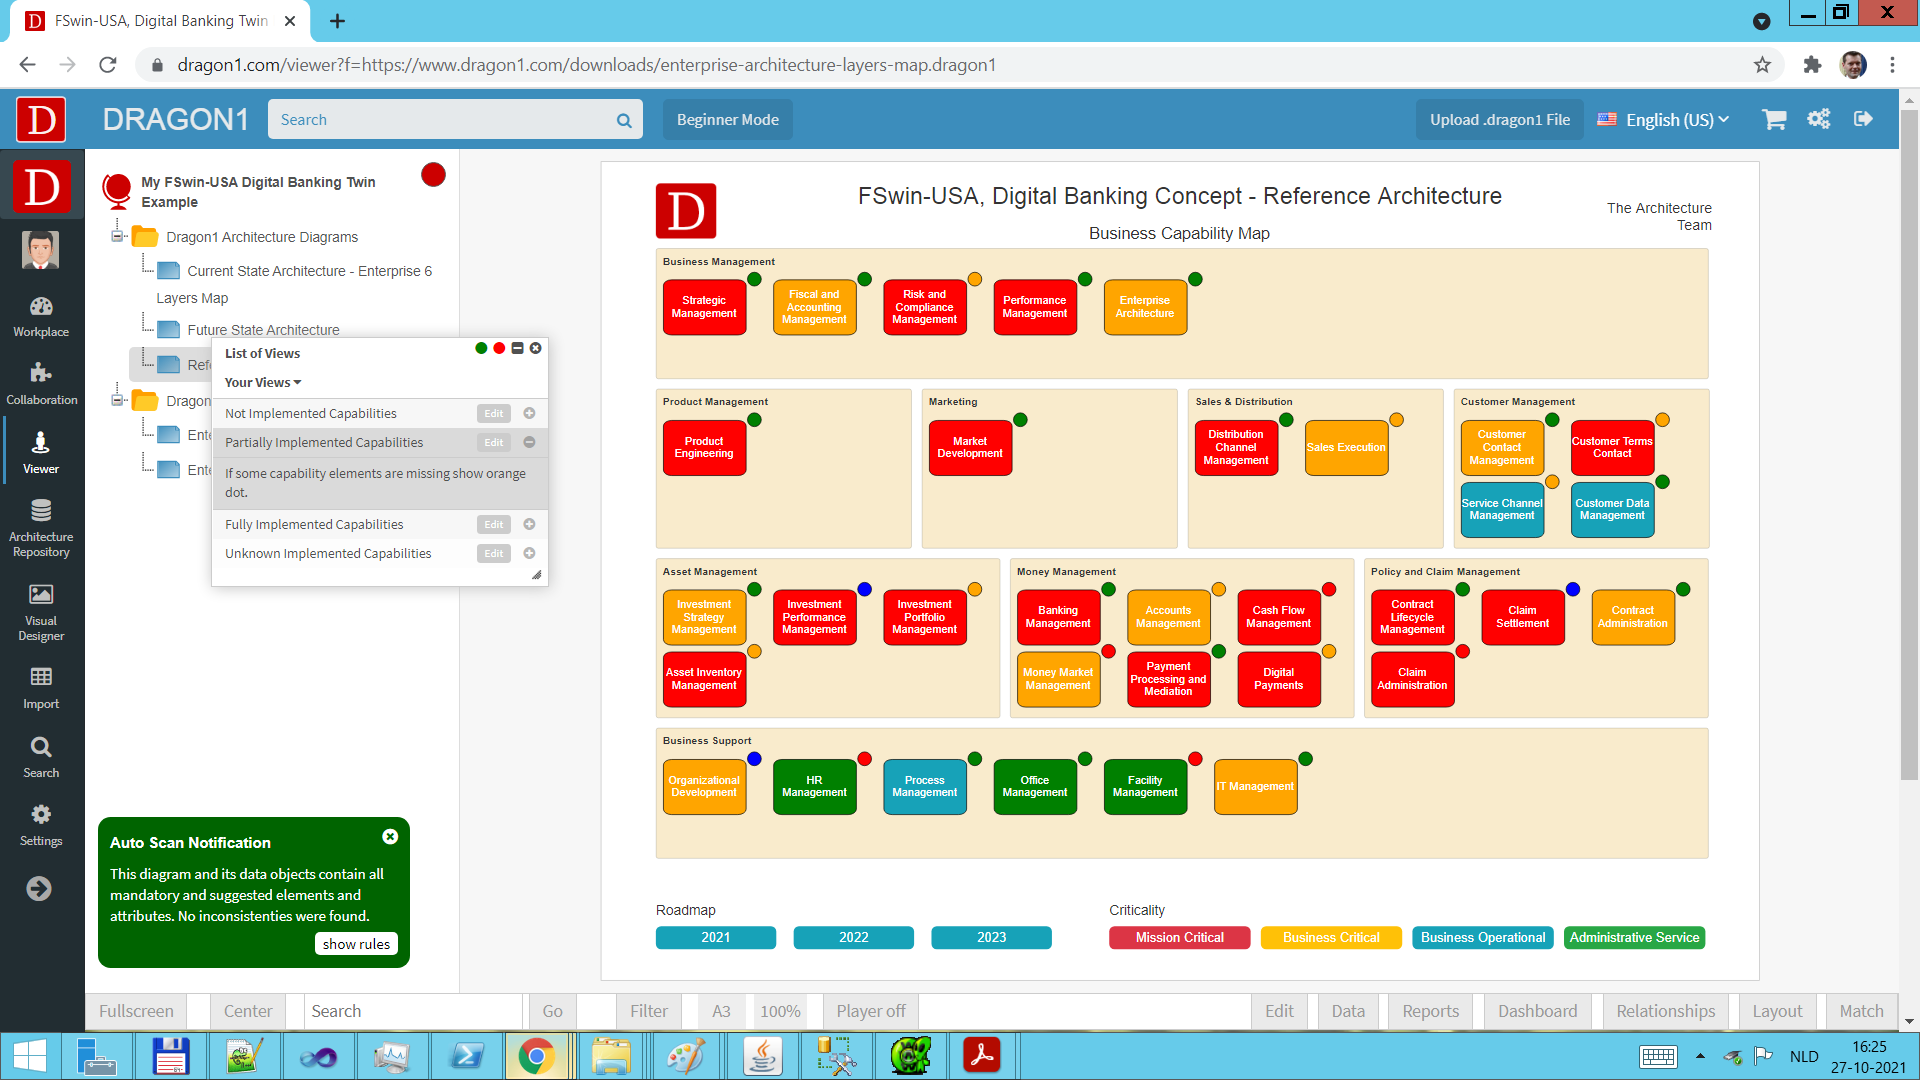
- Reference Architecture, containing the capabilities and their elements
In the Dragon1 Viewer, a user has many features to use and alter the tutorial:
- One can select views to analyze the data in the visualizations in more detail.
- One can see which capabilities are not implemented fully in the current state and what needs to be added or changed in the future state.
- One can see which elements every capability consists of.
- One can change any data in the tutorial. Such as the processes, applications, capabilities, principles, rules, and views.
The Viewer supports doing a round trip with .dragon1 Files (JSON) and Excel Sheets.
Because Dragon1 supports imports and exports of data in .dragon1 Files and Excel sheets, you, as a user, never encounter any vendor lock-in ever.
Dynamic Views
When you do the tutorial, you see a list of views shown.
Per layer, a couple of views are defined.
When you click on a view in the list, you see icons appear next to shapes, and you see shapes disappear or change color. This is based on the queries and rules of the view.
If you click on the first view, 'Manual Tasks', the shapes of the processes that contain manual tasks are colored red.
To see how this view is configured, click on the edit button in the view row.
The views are called Dynamic Views because when the data in the repository is changed, the views will immediately show a different result.
The Action Script help page lists the different options available to configure views.
Current State and Future State Capabilities
The FSwin-USA presents a fragment of the enterprise architecture of a financial company.
According to their strategy, they must gain certain capabilities to execute them.
Before they can improve capabilities, they created this atlas with a couple of diagrams that provide insights and an overview of the current and future state of their companies' enterprise architecture.
The reference architecture diagram contains the capabilities they want to gain.
The dots for a certain value can be toggled on and off by clicking on a view in the list.
The fill color of a capability shows how significant it is for the company's strategy.
With the buttons below the diagram, the criticality for a certain value can be toggled on and off.
Analyzing Capability Implementation
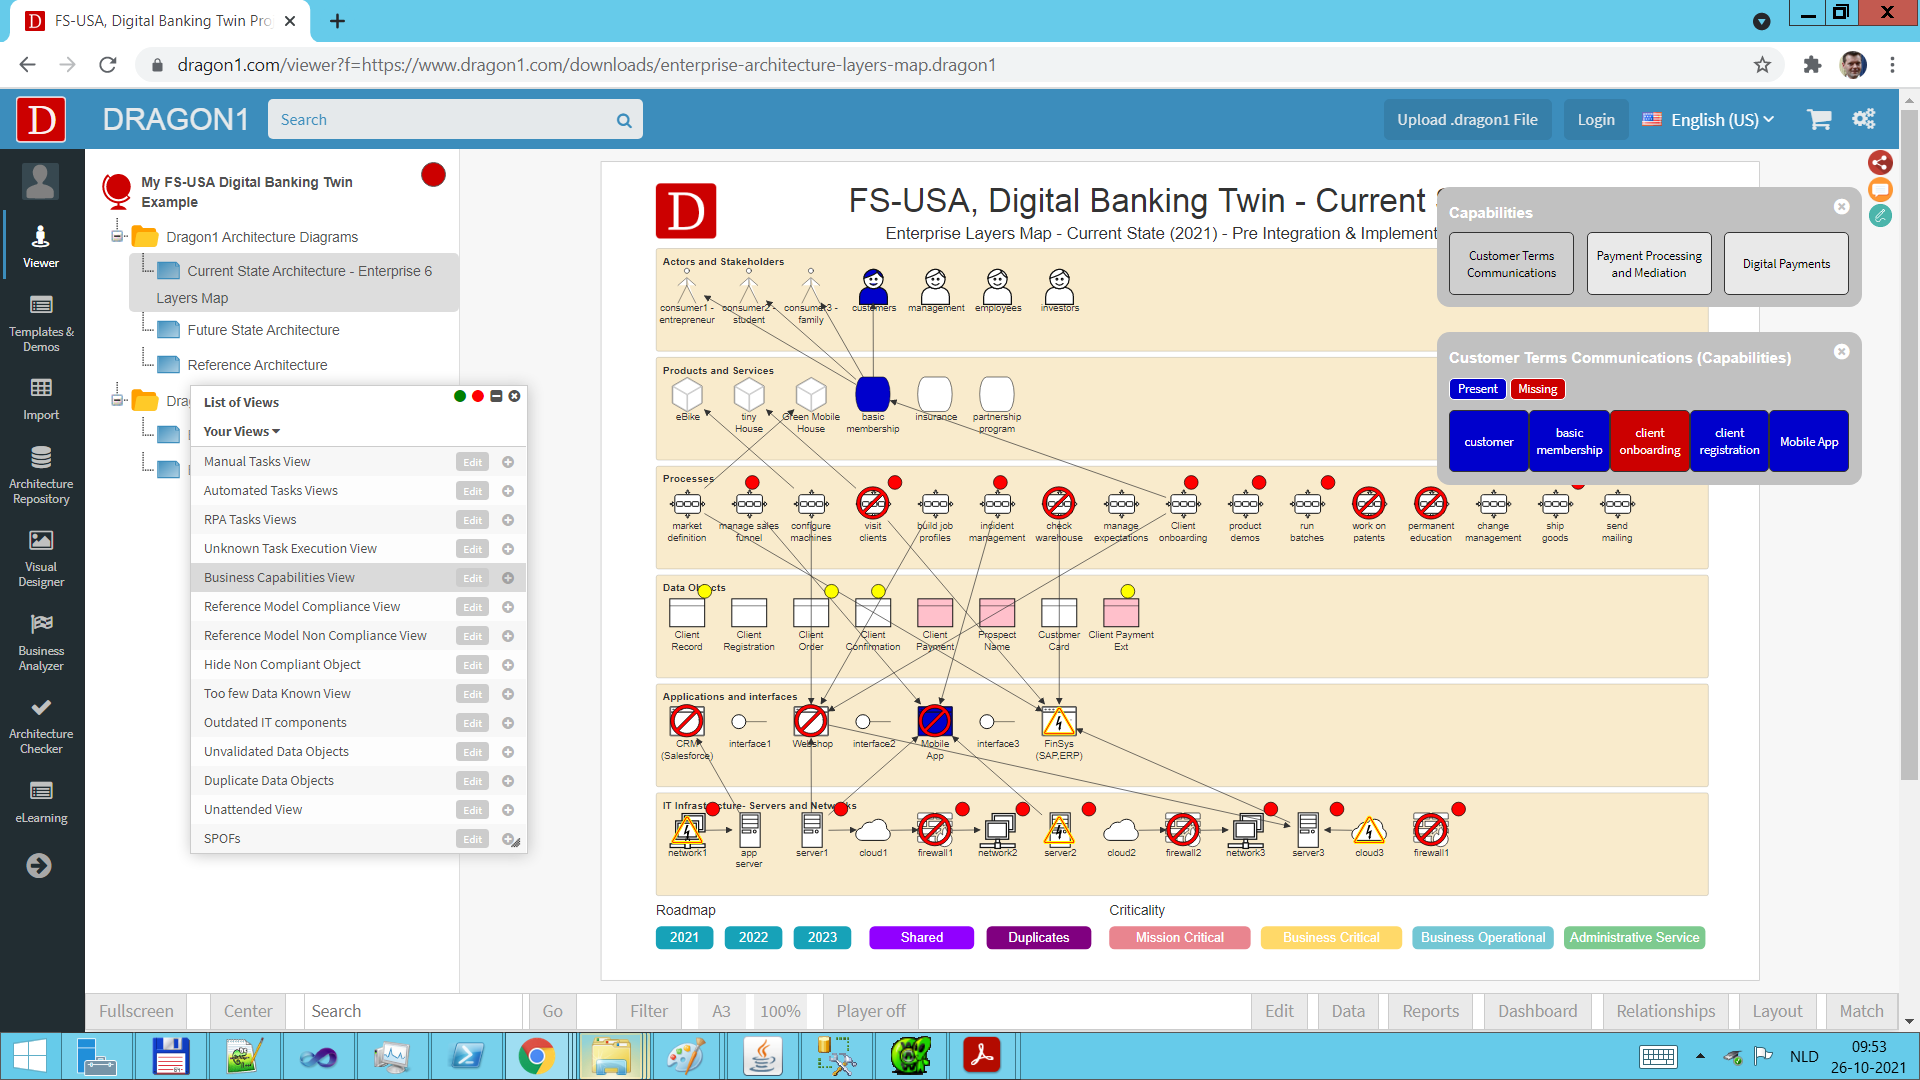
If you click on the business capability view in the current state diagram, you see that various required capability elements are missing or not implemented well enough.
If you click on the business capability view in the future state diagram, you see that most required capability elements are present and implemented well enough.
With this tutorial, you have an example of how creating current state and future state diagrams with dynamic views has added business value for planning business and IT changes.
Interactivity
If you go with your mouse over a shape in a diagram in the Viewer, a pop-up dialog box appears showing values for attributes of the corresponding entity (or data object).
More details about the corresponding entity are shown if you click on a shape.
If you press shift, you can drag the popup dialog, click on URLs, or drill down links if any are shown in the popup.


