Create An Interactive Application Landscape
Benefits of the interactive Application Landscape
An Application Landscape is an important visualization to create if an organization, manager, director, or architect wants to lower IT costs by standardization, deduplication, and rationalization.
- Standardization means: Reducing the number of application platforms, resulting in applications having to be replaced with the ones for certain functions that are available for that application platform.
- Deduplication means: Reducing the number of applications that provide more or less the same type of functionality.
- Rationalization means: Reducing the number of applications used for anything. Sometimes, applications are misused without a license, by mistake, or not allowed by company policy or other reasons. A reduction can often be established by looking at the reasons for using applications.
Other benefits of using an application landscape diagram to manage IT are 1) an increase in availability, security, integration, and stability and 2) a reduction of dependency and vendor lock-in. For instance: How often have you seen a vendor lock in a view?
This means that creating and using an application landscape diagram for management leads to cutting costs and saving money. It all comes down to creating a diagram with the correct and necessary information.
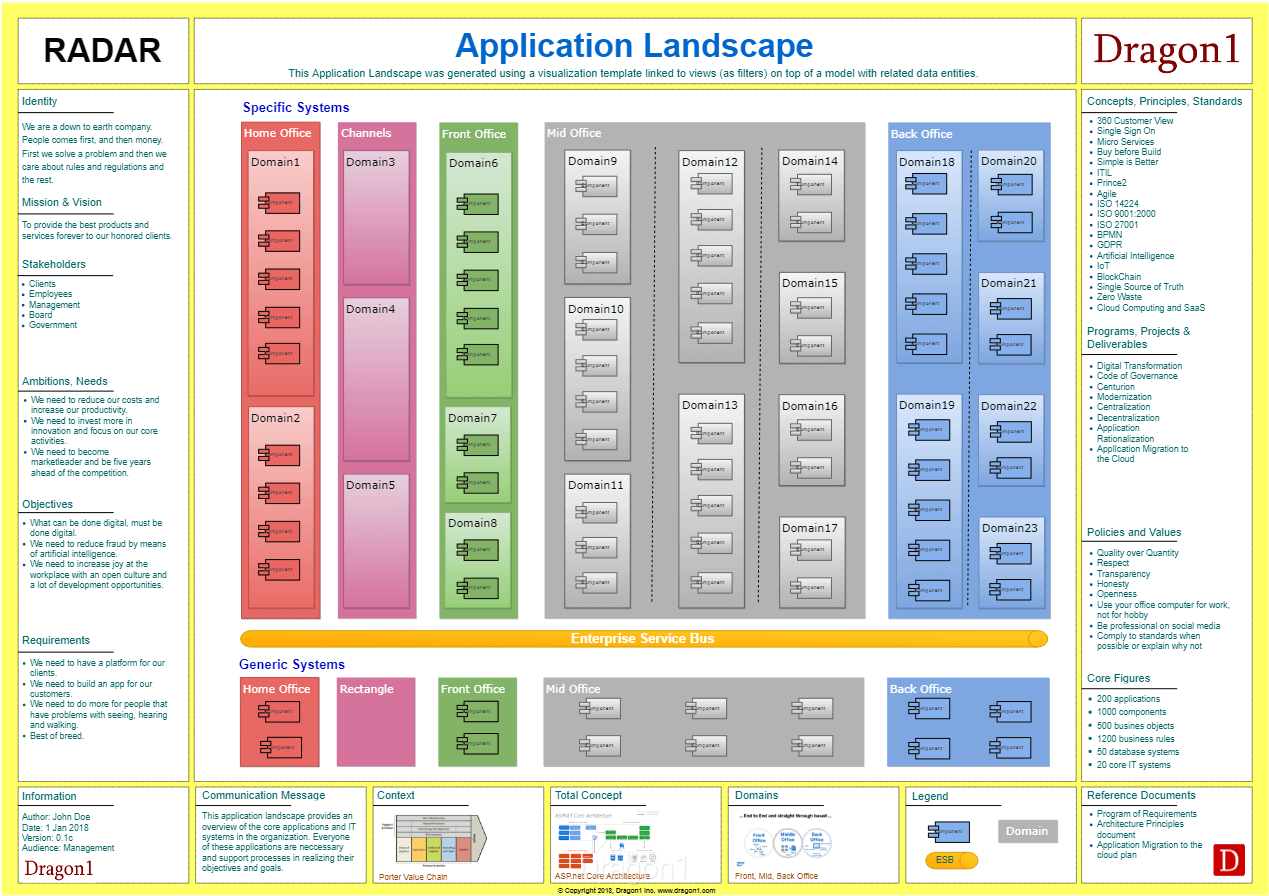
The Dragon1 definition of an application landscape diagram is a logical, functional, and physical technical overview of all the software applications in the information systems, their modules, objects, interfaces, and connections in an organization. But also the platform, operating system, vendor, provider, costs, licenses, usage, functions and services per application
This definition helps with the information we need.
1 Diagram, 10 Views
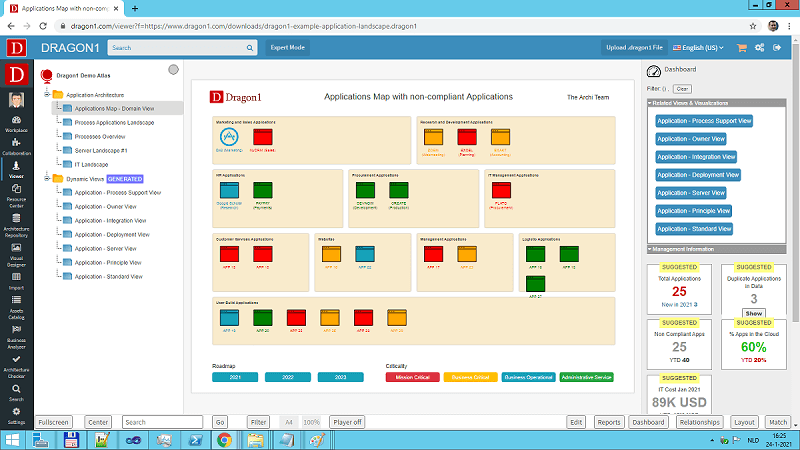
Normally, there is not one application landscape diagram. However, for every application landscape view, a separate diagram is made. One of the views is the top-level view, which provides access to other views. You can surf/click from one view to another via the Viewer. Dragon1 defines 25 default application landscape views. Read the blog here. Here in this tutorial, we are going to create three views/diagrams.
Learning Objectives
The learning objectives of this tutorial are:
- Create Dossier Structure
- Import Data
- Enter Data
- Create a Model
- Link Data to the Model
- Create Views
- Create a Visualization Canvas
- Insert an Architecture View Layout
- Create Indicators
- Getting Popup Dialog Boxes
- Create Visual Items
- Publish the Visualization
- Creating Extra Views and Diagrams
Create a Dossier Structure
The first task is to create a (logical) dossier structure in a cabinet (in your repository) in the Visual Designer. A dossier structure is a tree of logical folders. The data, models, views, and visualizations (diagrams) we will create are stored in these folders.
To create a dossier structure:
- Read the Setup Dossier Structure page
Import Data
Often, an organization has an IT Portfolio Management System containing information about applications, software, and hardware. Make an export of this information. First, create a simple file with a few applications and three of four attributes to import. Later, create a big file to import if you have mastered all the functionality.
You also have the option to add your attributes on Dragon1 to fit your imported data better.
To import data:
- Read the Import Data page
Enter Data
You do not need to import a file. You can also enter data manually. Or, if you have imported data, enrich this data.
To enter data:
- Read the Enter Data page
Create a Model
To create a model:
- Read the Create Model page
Link Data to the Model
To create a model:
- Read the Create Model page
Create Views
To create a view:
- Read the Create View page
Create a Visualization Canvas
To create a visualization canvas:
- Read the Create Visualization page
Insert an Architecture View Layout
To insert an architecture view layout:
- Read the Using a visualization Template page
Create Visual Items
To visualize the data of a view on a visualization canvas, you need to use a visual item. It is a shape/data placeholder.
To create a visual item:
- Read the Create a Visual Item page
Create Indicators
To create an indicator:
- Read the Create an Indicator page
Getting Popup Dialog Boxes
To get popup dialog boxes:
- Read the Popup Dialog Boxes page
Publish the Visualization
To publish a visualization:
- Read the Publish Visualization page
Creating Extra Views and Diagrams
As discussed, you often create multiple views (and, per view, a diagram). A stakeholder who wants to manage the application landscape diagram(s) can choose in this way which view is best used in what situation.
To create extra views and diagrams:
- Read the Working with Views page


