"The unified data repository cuts our integration time by 80%. It's a massive productivity improvement—less time wasted means more time is valuable for governance and strategy. Dragon1 Data Engine is an incredible tool."
"We no longer need a data architect or engineer for every new visualization. Dragon1 Data Engine handles positioning, layering, and connections perfectly, allowing our architects to focus on design rather than data modeling syntax."
"Our teams can prototype 'what-if' scenarios and impact analyses on the fly. The engine's ability to generate metrics and model relationships means less reliance on our own, often siloed, data for initial analysis."
J
Gustave Schmitz, Business Architect "The data mapping and data quality comparison dialog is amazing. It greatly points out exactly what changes when introducing a new data source, drastically reducing the analysis time for data impact assessments."
V
Arvind Gopalanram, IT Manager Generated Architecture, Business, Technology Maps
The Data Engine is preconfigured to generate all key enterprise views. 100% no modeling required. Also not modelled data is turned into diagrams or views:
- Enterprise Layers Maps
- Motivation/Strategy Maps
- Capability Maps
- Process Maps (BPMN)
- Data Maps
- Application Maps
- Server Maps
- Network Maps
- Architecture Principles Maps
- IT Standards Maps
- UML Class Diagrams
- UML Activity Diagrams
- And more
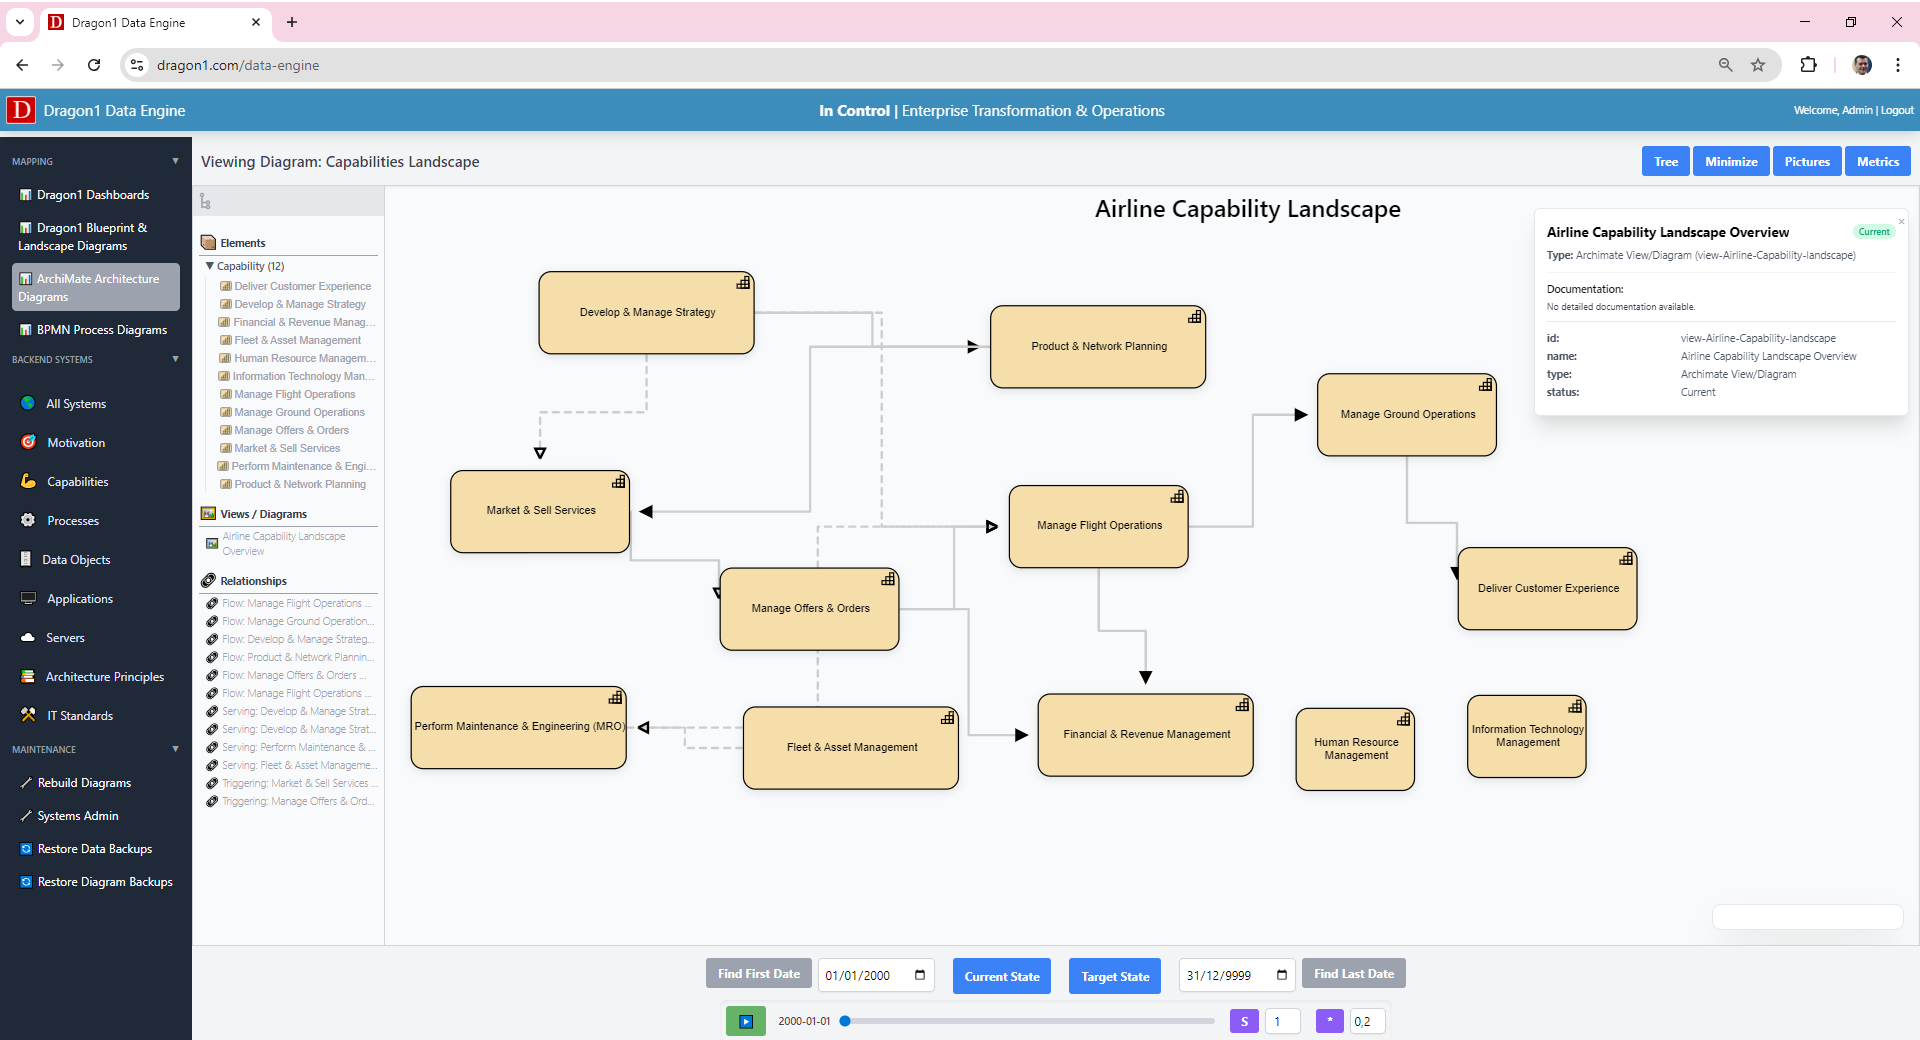
A 100% auto-generated and auto-styled Capability Map.
Time Lapse & Scenario Comparison: Continuous State Analysis
The Time Lapse & Scenario Comparison feature is a very powerful differentiator, allowing you to move beyond simple current and future states.
- With Time Lapse & Scenario Comparison, you can not only view the current state and future state, but also any date in between. For instance, you can find the optimal path or date for a transition by analyzing how metrics such as risk and cost fluctuate over the project timeline. You can also compare three different lists of changes. And generate roadmaps from it.
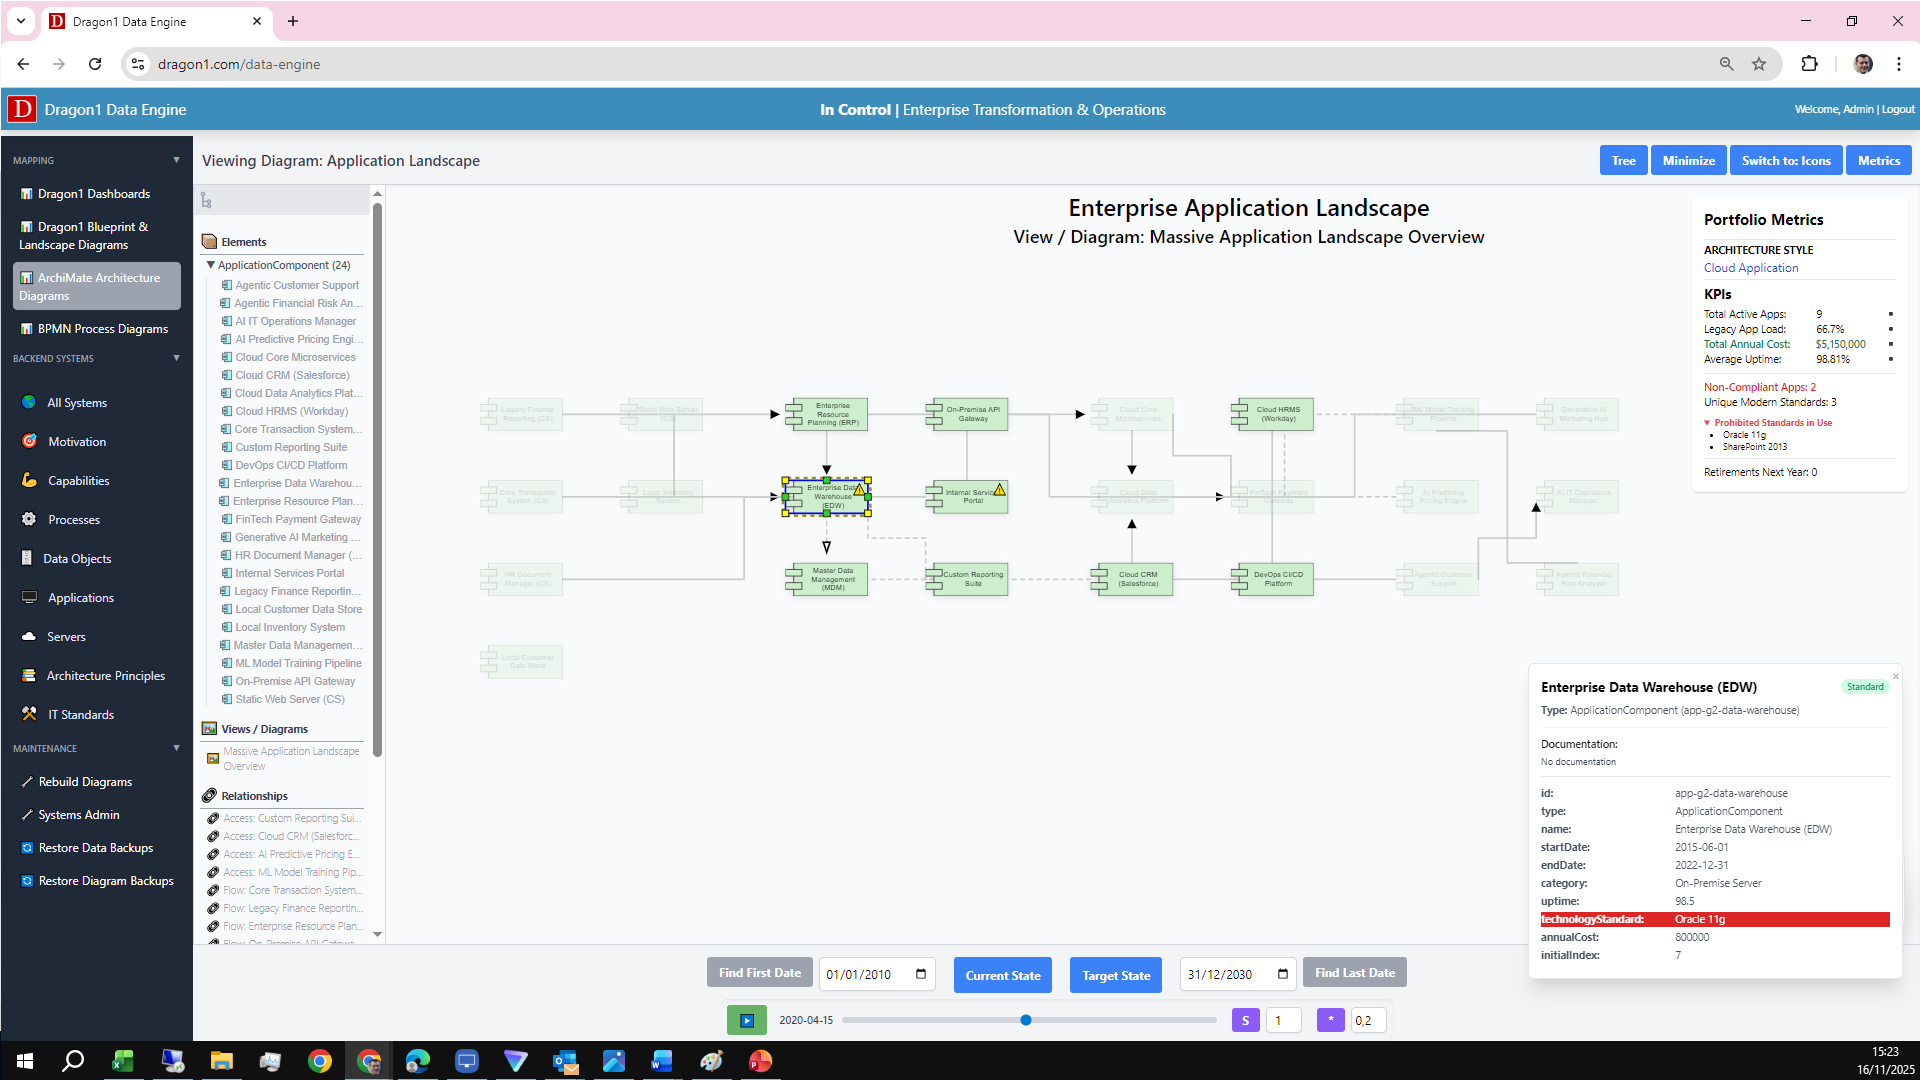
Interface for selecting a historical or future date for analysis.
KPIs / Metric Panel on Every Diagram
Every generated diagram features a dedicated KPIs / Metric Panel that shows real-time metrics. This immediate context helps analysts and decision-makers assess key indicators, such as risk, cost, and performance, directly on the architecture view.
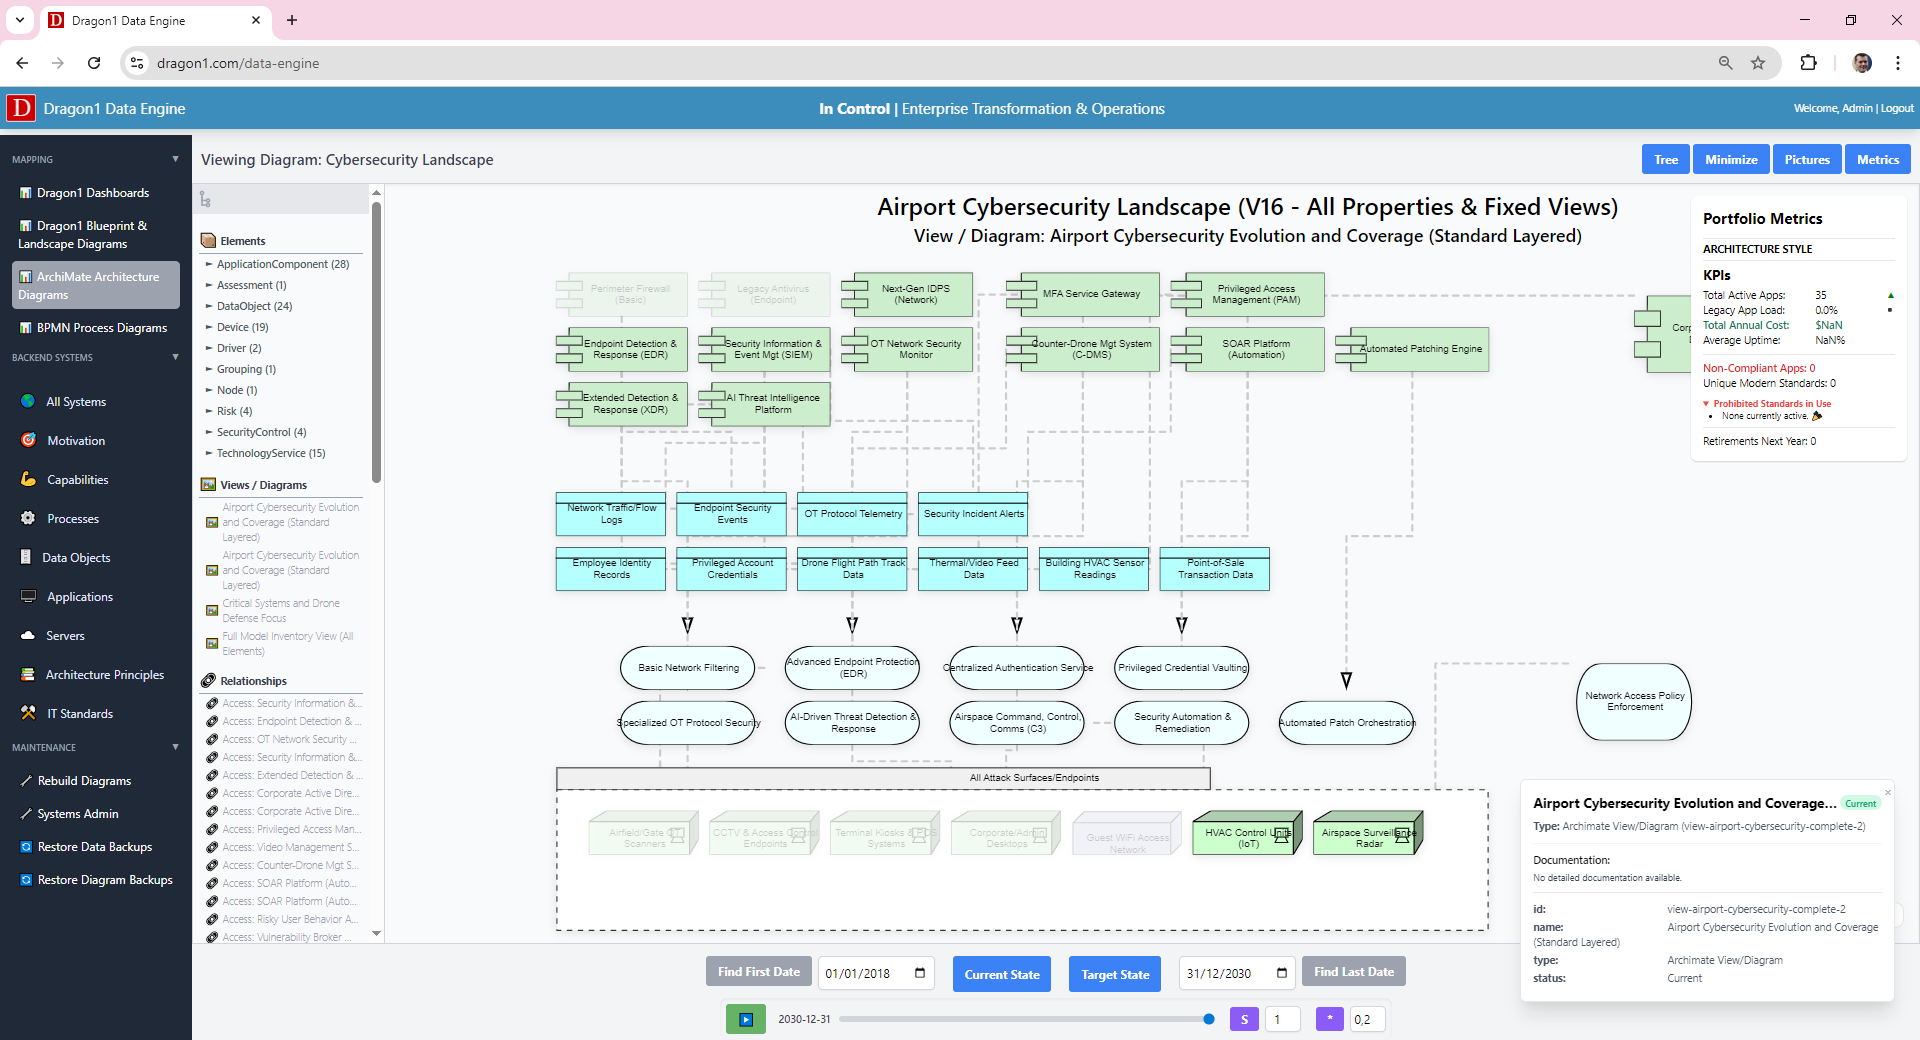
Detailed view of a Metric Panel showing a high risk score.
Overview Dashboard & Detailed Dashboards: Your Single Pane of Glass
The Data Engine produces an overarching dashboard that aggregates metrics from all architecture diagrams, providing a holistic enterprise view. And with 1 click to visit a detailed dashboard on that topic and even drill down to architecture diagrams & process maps.
- 12 Default Control Panels:
- Architecture areas: Products, Services, Processes, Applications, Data Objects, and Servers
- Management areas: Finance, Logistics, Sales, Production, IT Operations, Cybersecurity
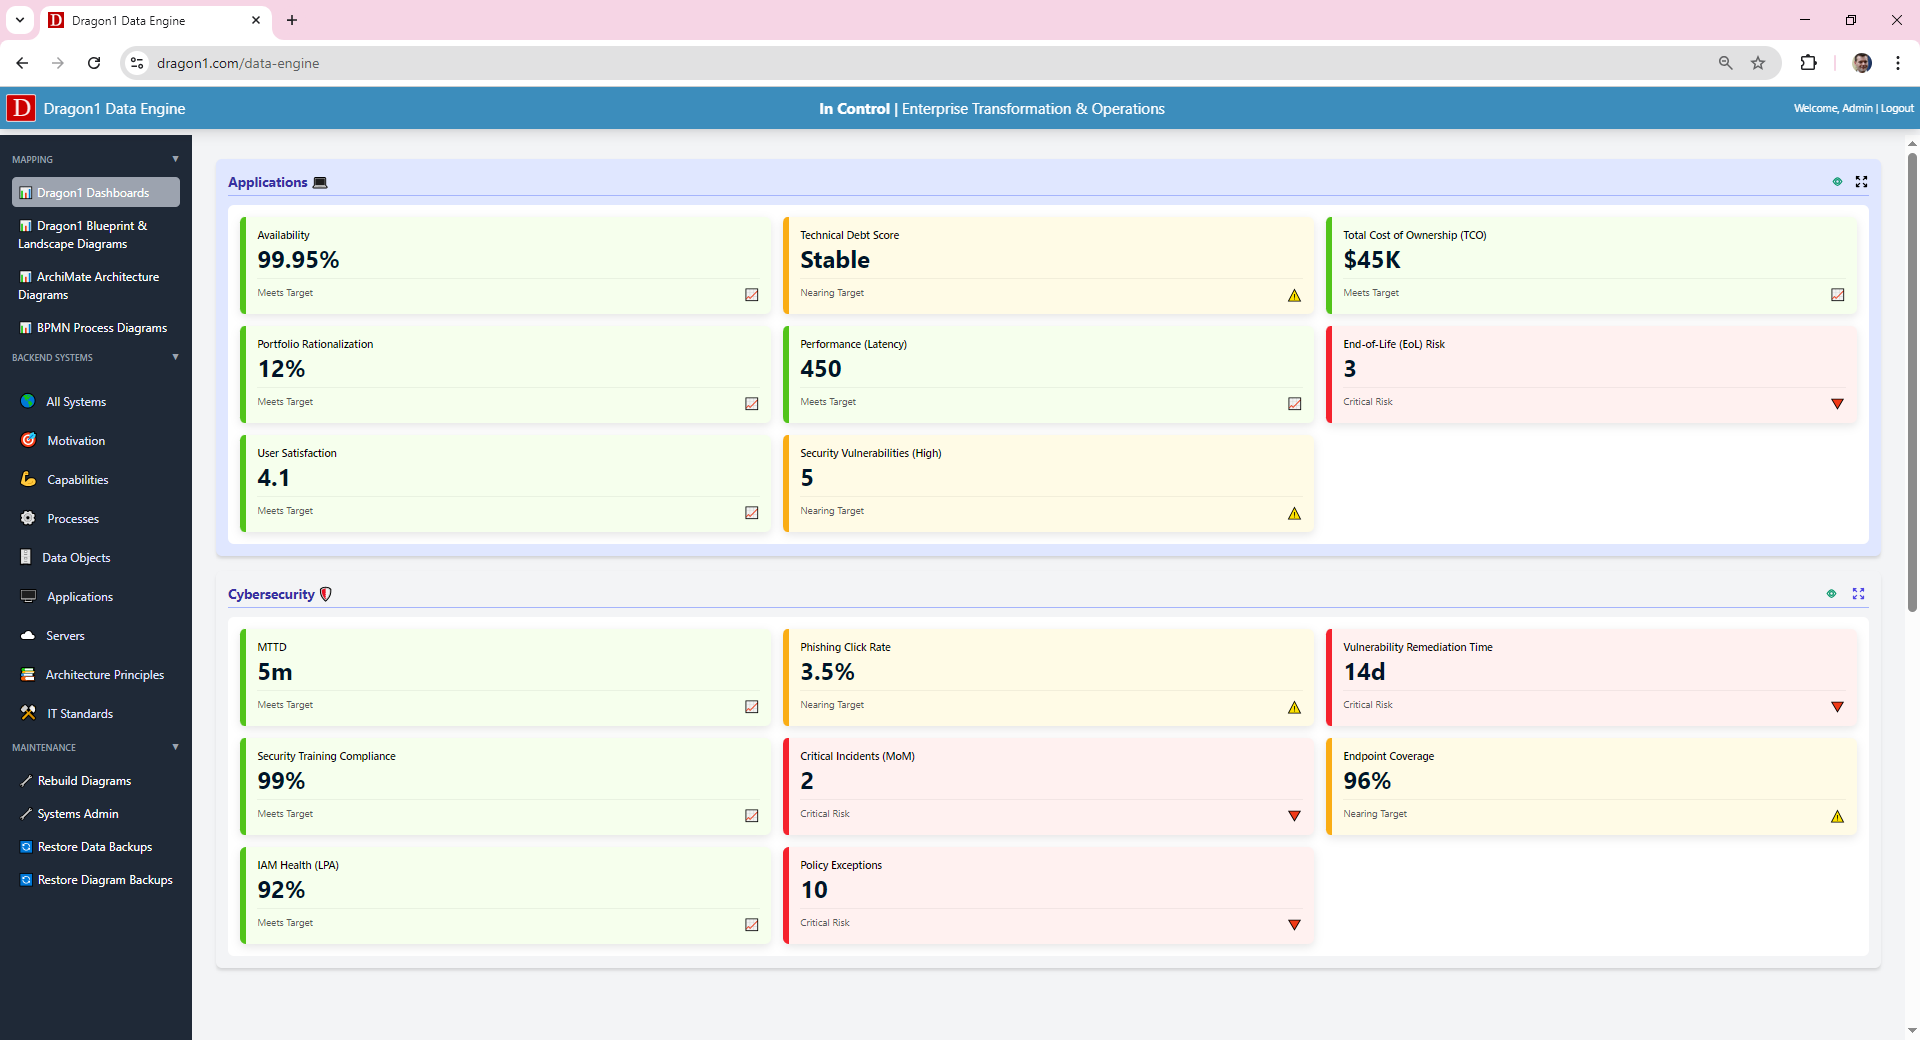
Two example details dashboards - that drill down to architecture diagrams & process maps.
Data Sources Linking Overview
The core function of the Data Engine is to establish a single source of truth for the entire enterprise. Dragon1 Data Engine connects to various authorized source systems to automatically collect, validate, and transform operational data into the structured model data required for your architecture visualizations (ArchiMate, BPMN, UML, Dragon1). This integration ensures that all generated maps and real-time metrics are based on current, reliable information.
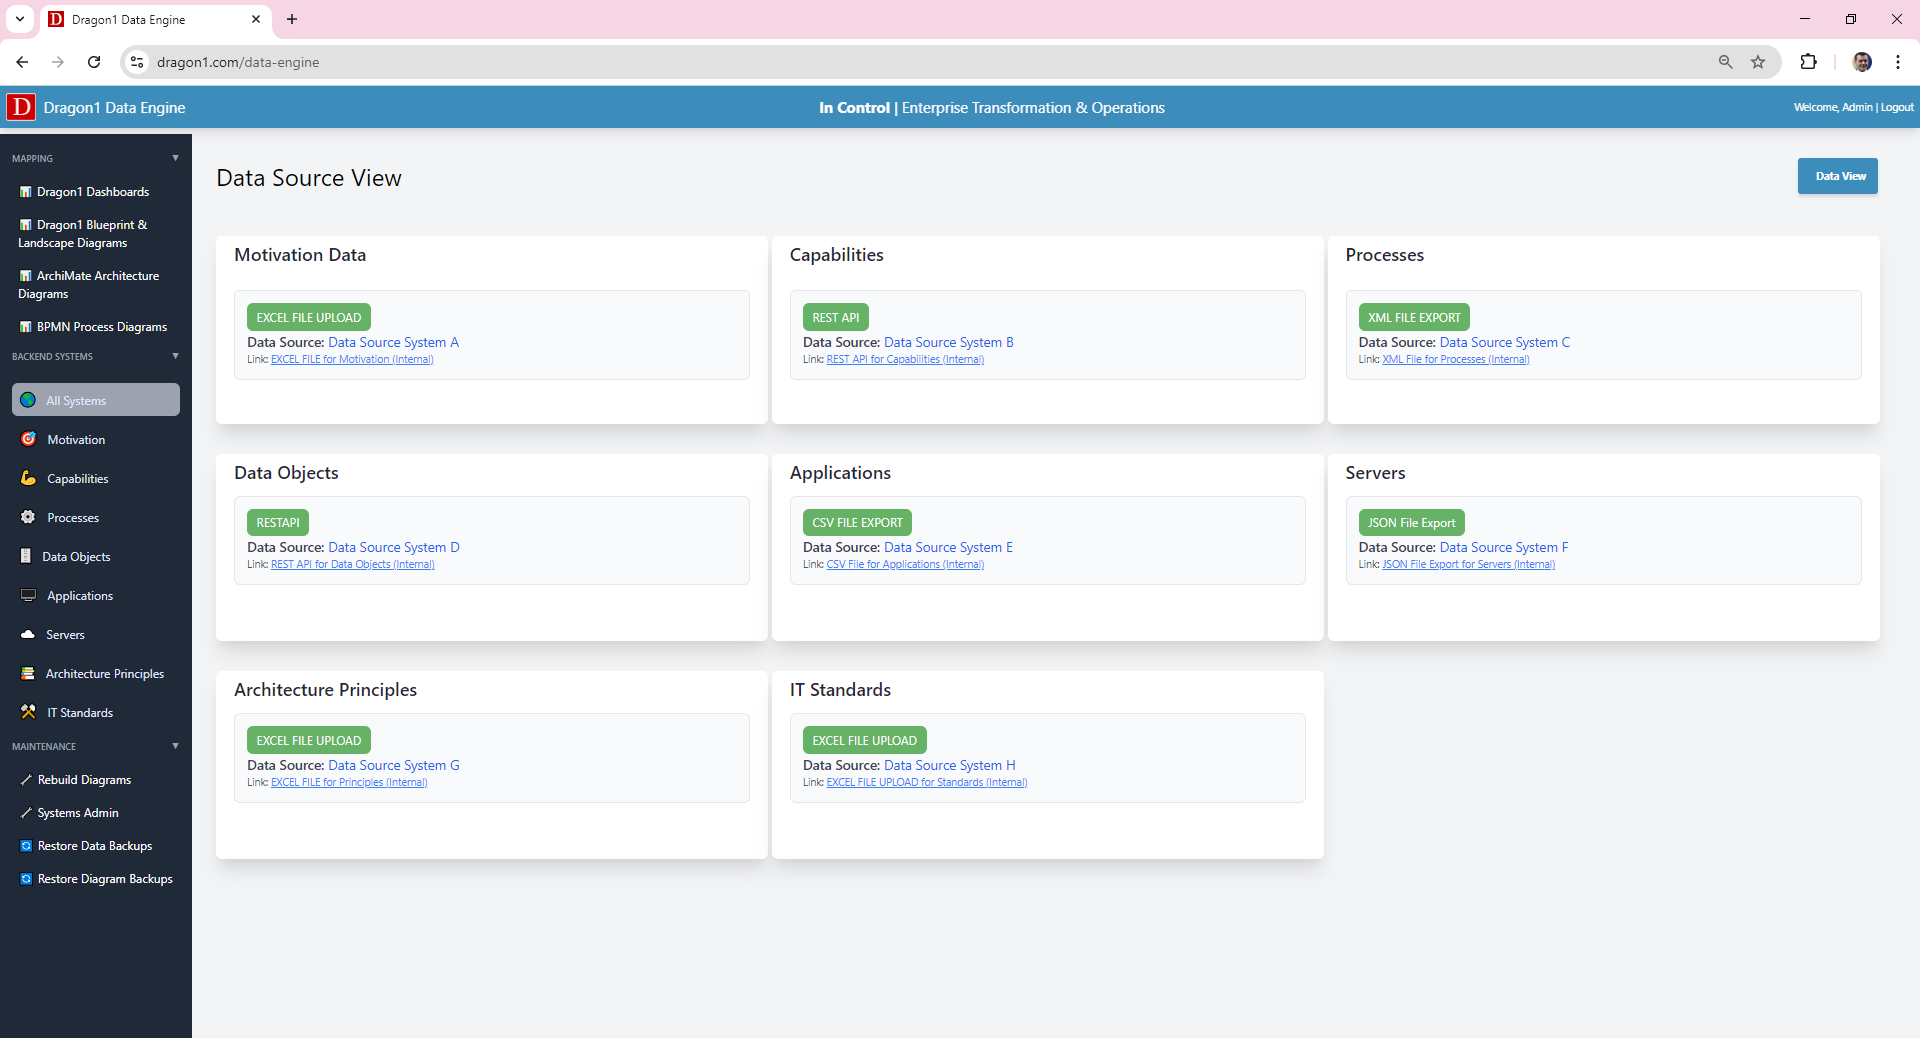
Integrated Data Sources Linking Overview.
Data Mapping, Mining and Filtering
This powerful feature is the bridge between your raw source data (like spreadsheets, CMDBs, or monitoring logs) and your Enterprise Architecture model. Data Mapping involves harmonizing inconsistent terminology and data schemas from various sources into a single, standardized metadata structure. Filtering ensures that every generated visualization is relevant, up-to-date, and focused on a specific architectural concern (e.g., current state, future state, or risk profile).
- Schema Normalization:
- Class Mapping: Define rules to translate source system objects into target system objects (components may become applications, requirements may become principles)
- Attribute Mapping: Define rules to translate source system values (e.g., an application status of 'Prod' in the CMDB) into target model attributes (e.g., the lifecycle stage 'Active' in the Dragon1 model).
- Relationship Mapping: Automatically infer and create traceable relationships (e.g., a 'Service' is realized by an 'Application') based on unique identifiers shared across different data sources.
- Runtime Filtering: Use dynamic filter expressions to determine the scope of a visualization. For example, show only applications with a Technical Fit Score below a certain threshold or projects that are currently 'On Track', directly influencing the content of a generated map.

Data Mapping, Mining, and Filtering Screen (available on request).
Automated Application Portfolio Rationalization
Reducing IT spend and eliminating redundant/outdated applications (Application Rationalization).
The Engine connects to the CMDB (for infrastructure cost/host data), the Project Management System (for investment data), and the monitoring tools (for performance/utilization).
Dynamic Compliance and Regulatory Impact Analysis
Ensuring compliance with new regulations (e.g., GDPR, industry standards, internal security policies).
The engine automatically maps regulatory documents to the affected business processes and applications, instantly generating a risk heatmap that shows the scope of required changes.
Business Capability to Technology Roadmapping
Translating strategic objectives (like 'Improve Customer Experience') into concrete IT projects and technology changes.
By linking current applications to supporting capabilities, the engine visualizes the capability maturity gap and provides a data-driven basis for prioritizing and funding the strategic investment roadmap.
Dragon1 Data Engine is an incredibly powerful tool for business and operational monitoring.
It effectively automates the most time-consuming and error-prone parts of maintaining an EA Repository and Blueprints: data integration, transformation, and establishing traceability.
The Data Engine acts as an EA Repository Connector and Automation Layer.
Instead of manually collecting and updating data in static files, the tool pulls live, authoritative data from your source systems (CMDB, HRM, Project Management, Monitoring Tools) and transforms it into the structured JSON Data format required by the Dragon1 Viewer.
Dragon1 Data Engine: The Go-To Add-On
Dragon1 Data Engine is a powerful, non-invasive layer that combines data analysis with visual architecture modeling to enrich the data from your operational systems, giving it strategic context. Instead of requiring manual data entry, the Engine connects to these major platforms via APIs or data extracts, transforming live inventory, performance, and financial data into dynamic EA models and visualizations.
ServiceNow (CMDB/ITSM)
Converts raw IT asset and relationship data directly from the CMDB into a strategic Architecture Model (e.g., ArchiMate), providing a complete, traceable inventory for EA.
Turbonomic / AppDynamics
Integrates real-time Performance and Cost metrics with application objects in the model, directly populating the Metric Panels to justify modernization or retirement.
Jira / Azure DevOps
Connects Project, Epic, and Status data to the EA Roadmap, visualizing the live progress of architecture transformations and capability improvements.
SAP / Oracle ERP
Pulls Financial and Organizational data (e.g., TCO, ownership, vendor details) to provide the critical business context needed for portfolio management decisions.
AWS / Azure / GCP
Automatically imports Cloud Inventory and configuration data, ensuring the generated Cloud Architecture Maps are always accurate and compliant with defined standards.