Special Care company 's-Heerenloo communicates Information Strategy
's-Heerenloo - Facts & Figures - With revenue of €600 mio, 14000 employees and 7000 notable care clients in 2011, 's-Heerenloo is the most significant and most crucial special care organization in the Netherlands
Background
At 's-Heerenloo, because of their new Information Strategy, the CIO needed to communicate ideas and the impact of new information & and IT solutions as part of the strategy. The CIO and the management team sought to create additional support for the strategy and calculate the impact of changes to inform decision-making more effectively.
Information Strategy
Dragon1 enabled this by allowing the client to visualize different views of the strategy: static views to show to various stakeholders and interactive/playable views to test and study the impact of changes.
The Case
Three visual architecture products were created with Dragon1:
- Design Book
- Blueprint
- Roadmap
Solution Strategy
Below, in short, these three products are detailed:
1. Visualizing Principles in a Design Book
At 's-Heerenloo, the impact of the most important information principles was visualized. They selected the most important information principles that needed to be implemented to execute the information management strategy.
2. Enterprise Architecture Blueprint
The information principles and their impact were visualized with principles drawn in a design book. In this way, management can adjust the strategy's impact and, with the same visualization, communicate its impact to create more support.

Information Strategy Roadmap
Challenges
At 's-Heerenloo, Dragon1 was used to visualize an EA Blueprint. After a few workshops, data was collected in Excel sheets, which were imported into Dragon1 EA Tool - Enterprise Architect. Then, a layered EA blueprint was created with view templates in the tool.
With the blueprint, everyone has an overview of the structure. This makes it much easier to freeze, focus, and discuss issues. Everyone has insights into their role in the organization. There are a lot of benefits with only one visualization.
The rollout of new information services is dictated in the information strategy. The business that ordered these services was curious to know when the new information services would appear and their dependencies.
Outcomes
Because the business may want to promote certain information services to arrive before others.
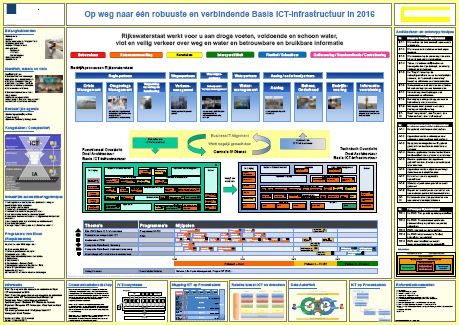
For this purpose, a roadmap poster was created showing all the business functions and departments side by side and below the need for and actualization of the new information services with their interdependencies.
Immediately, this roadmap impacted the planning of information services. To the right, you see a generic example of a roadmap. The actual roadmap may not be displayed here due to security concerns.
Do you want to know more about this case study?
You can contact us via info @ dragon1.com for more information.