Mapping
Why Mapping of Data and Information Matters
Mapping is a powerful tool that helps us comprehend large, complex datasets by visually representing them clearly and concisely. It helps us identify patterns, trends, and relationships that might otherwise go unnoticed. By transforming raw data into interactive maps, charts, graphs, diagrams, blueprints, landscapes, roadmaps, heatmaps, etc., we can communicate information more effectively, identify patterns, trends, and correlations, and make data-driven decisions.
Mapping Examples
Dragon1 has been used across industries for the mapping of data in innovative ways. Here are some examples:
Data Mapping
Network Diagram
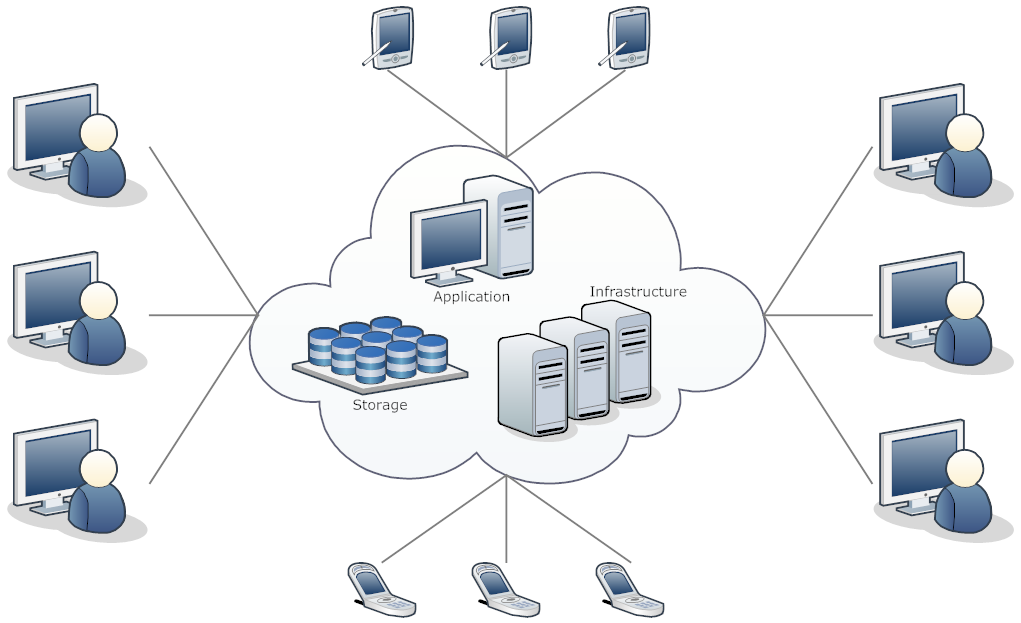
A network diagram shows the connections between different devices in a complex IT infrastructure.
Venn Diagrams
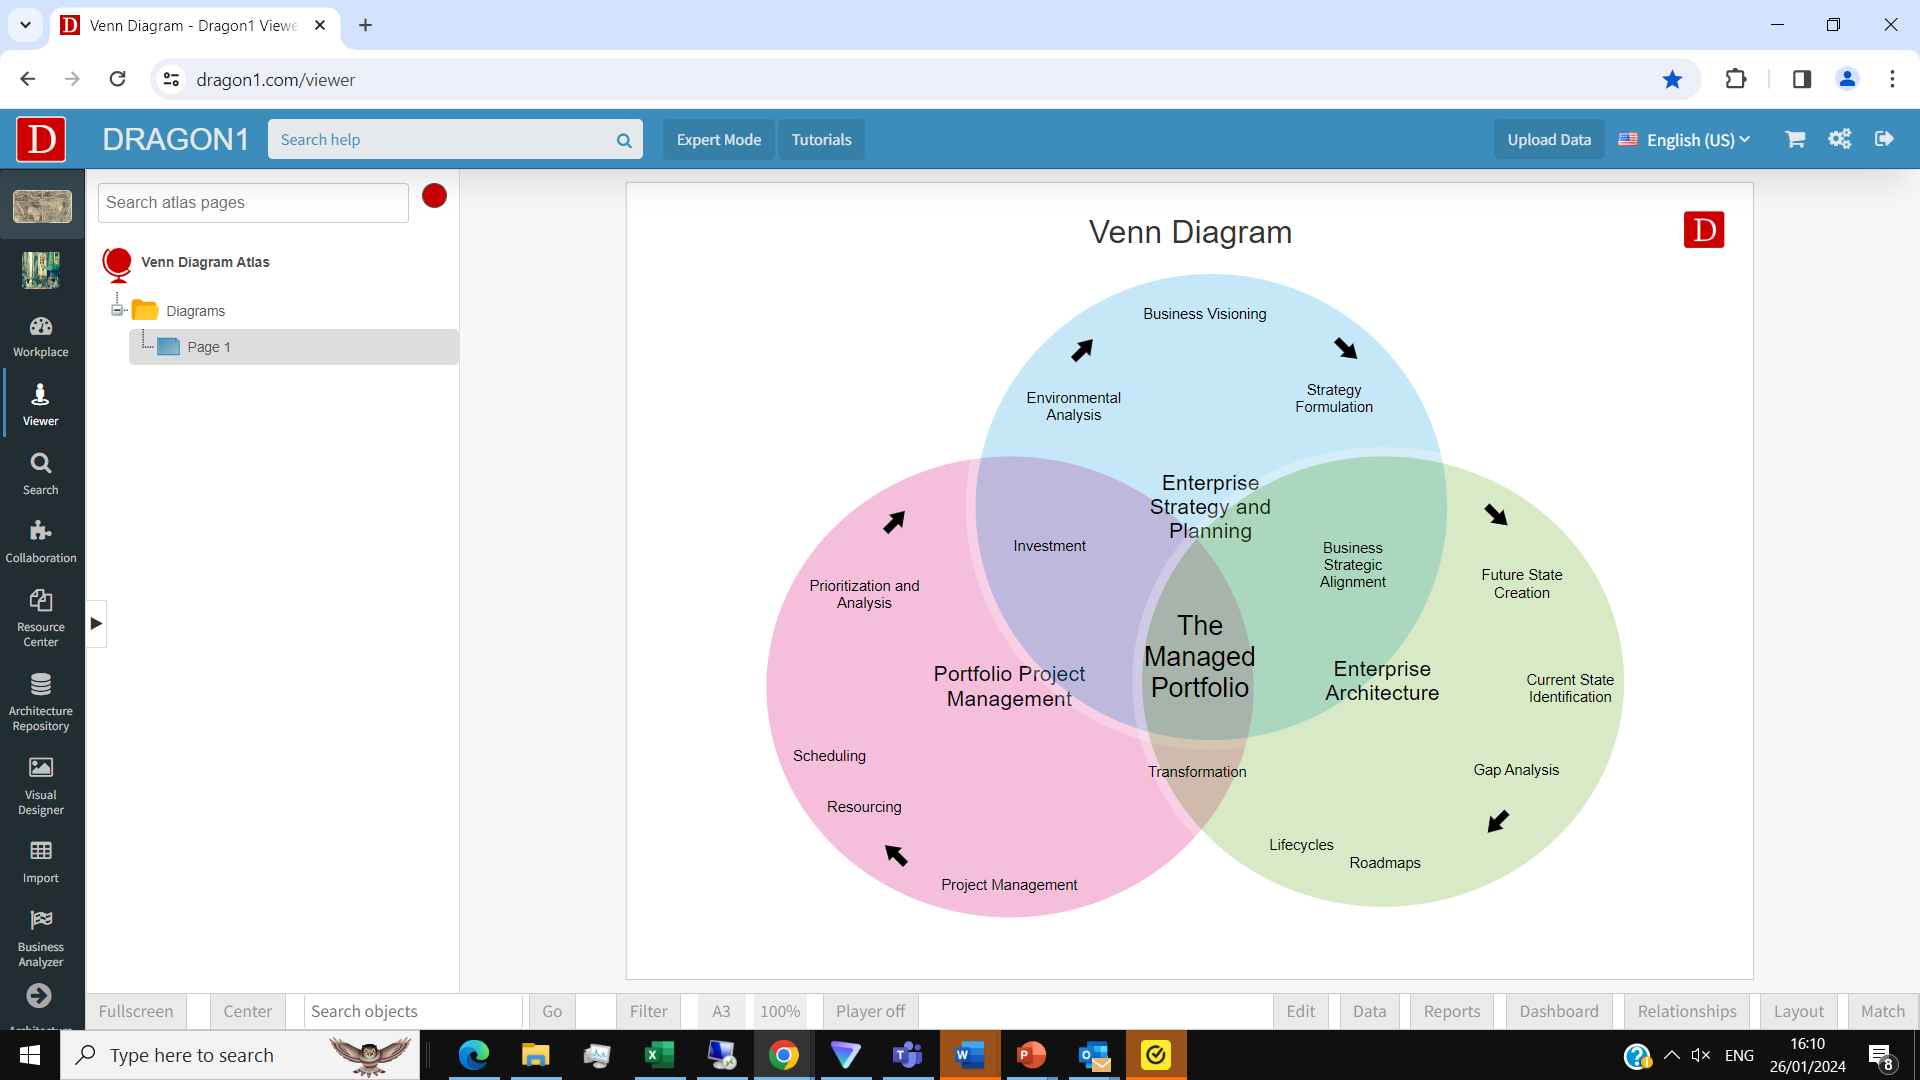
A Venn diagram or a Venn chart uses overlapping circles to visualize the logical relation between specific things, like concepts.
Process Mapping
Process Flowchart
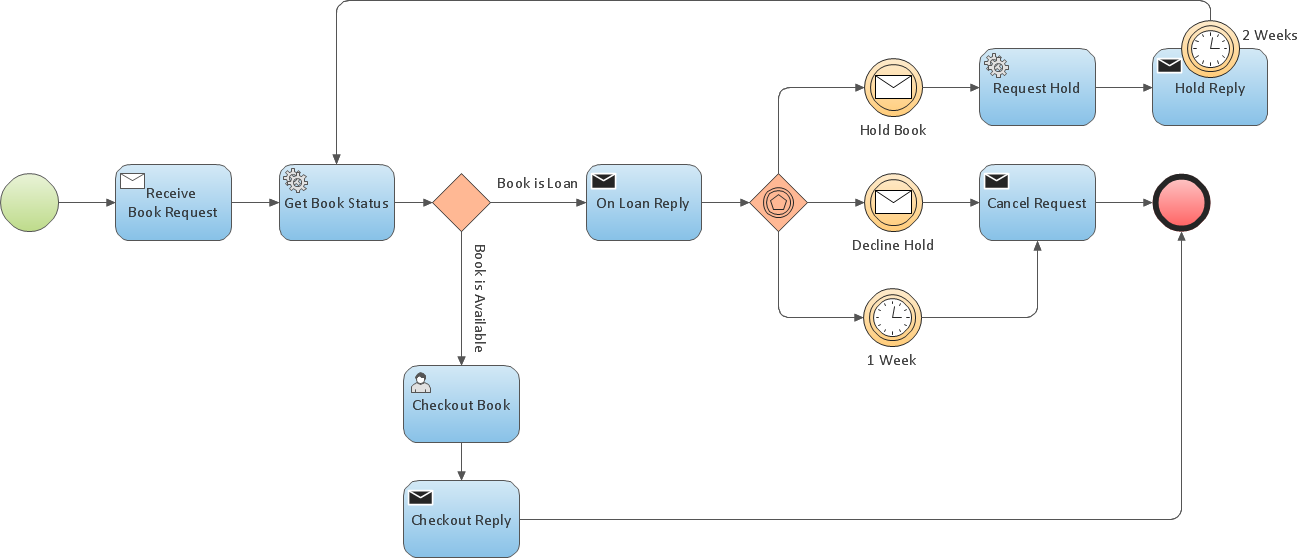
A process flowchart illustrating the sequential steps involved in a booking process.
Map Mapping
Map
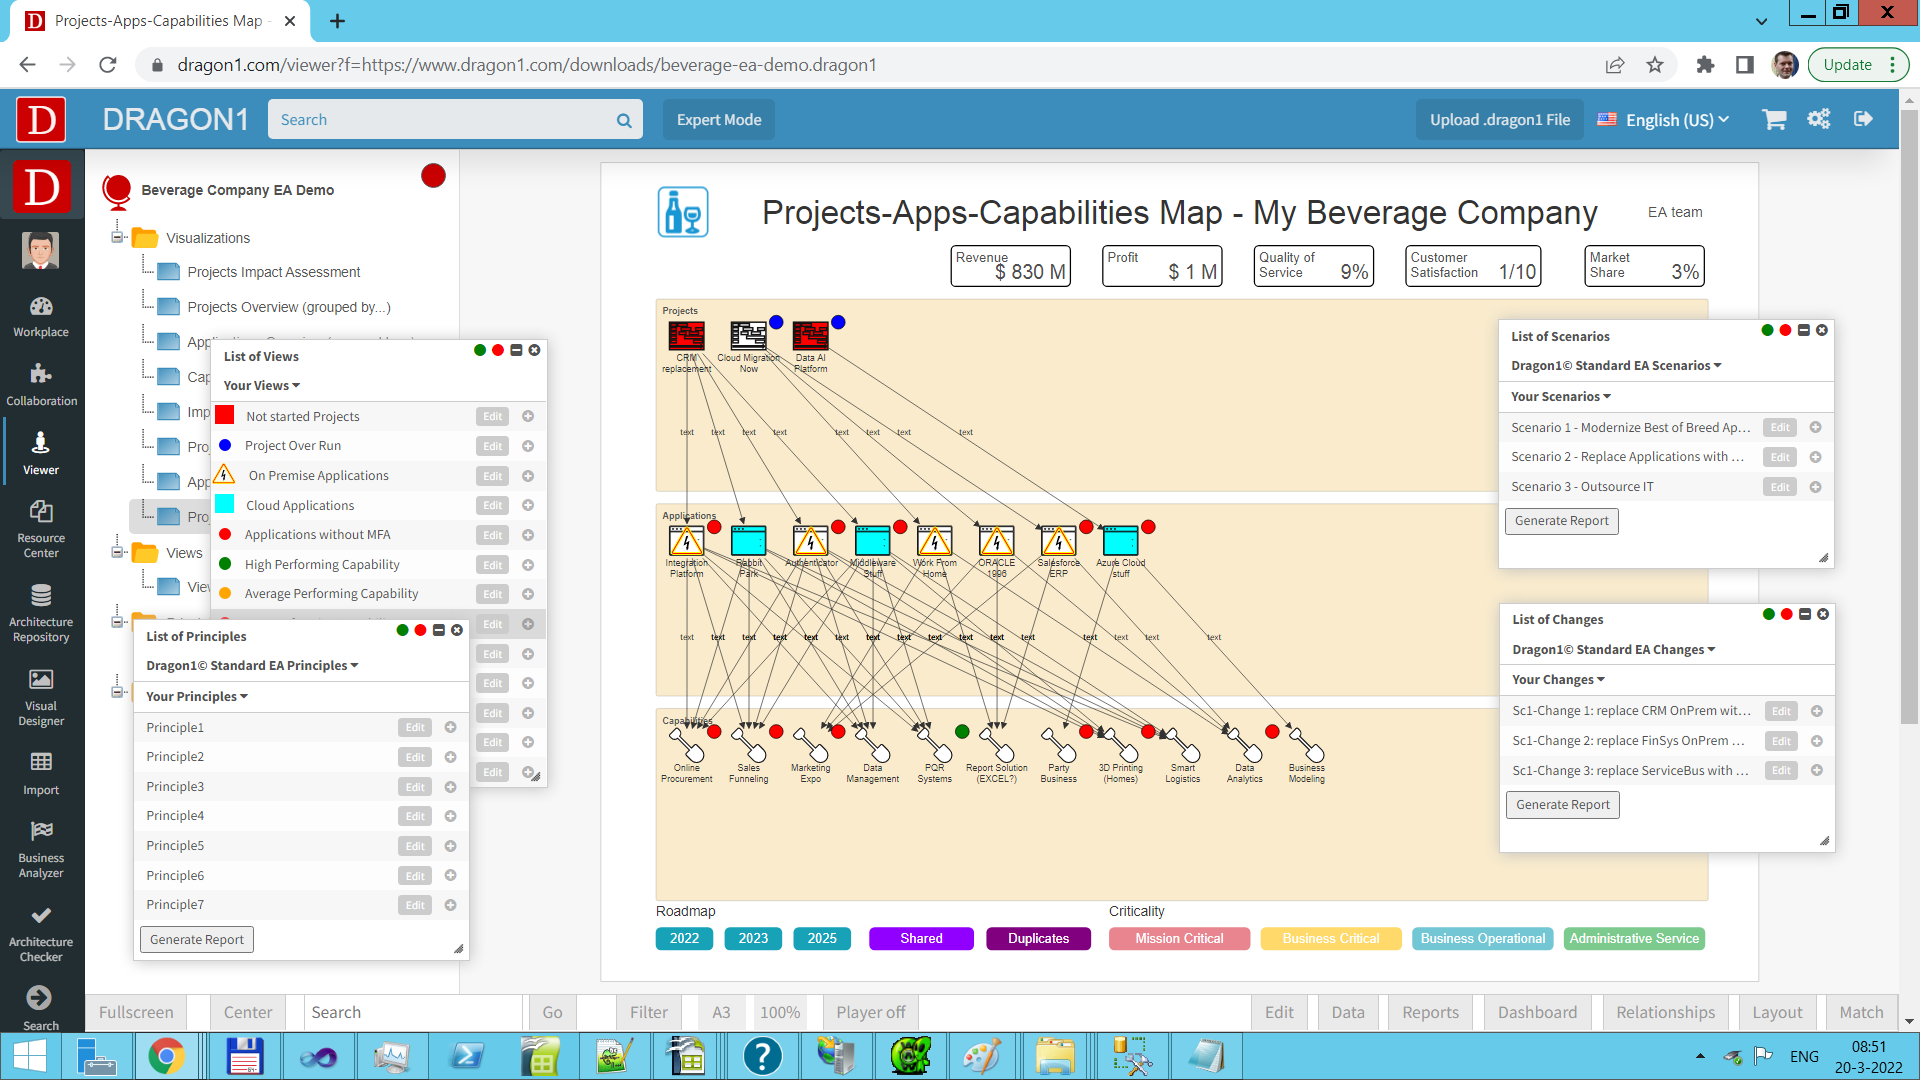
A data map with color-coded regions representing sales performance across different geographic areas.
Heat Map
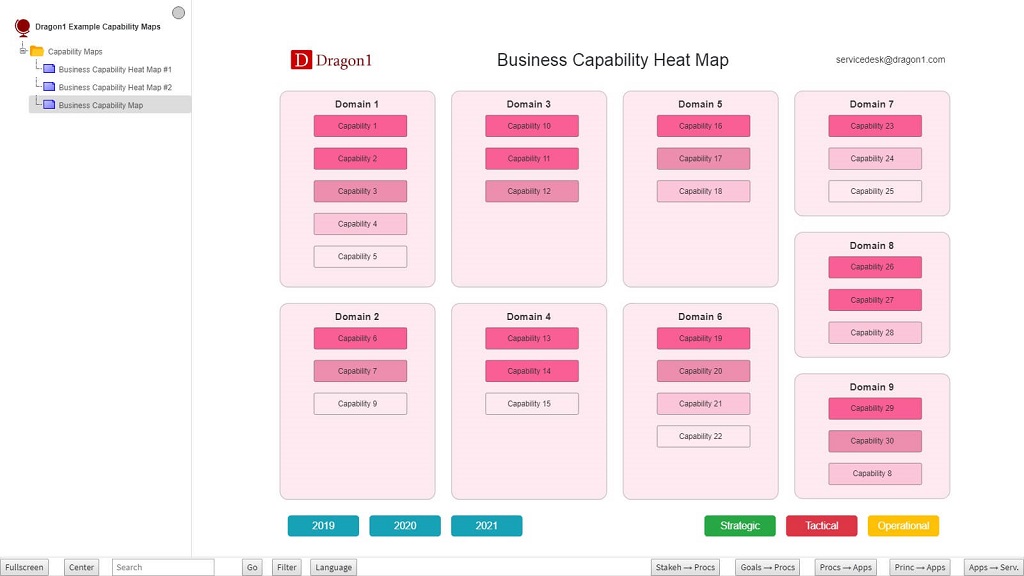
A Heat Map is a two-dimensional data representation in which a system of colors represents different values.
A simple heat map provides an immediate visual summary of information across two axes, enabling users to identify the most important or relevant data points quickly. More elaborate heat maps help viewers understand complex datasets.
Roadmap
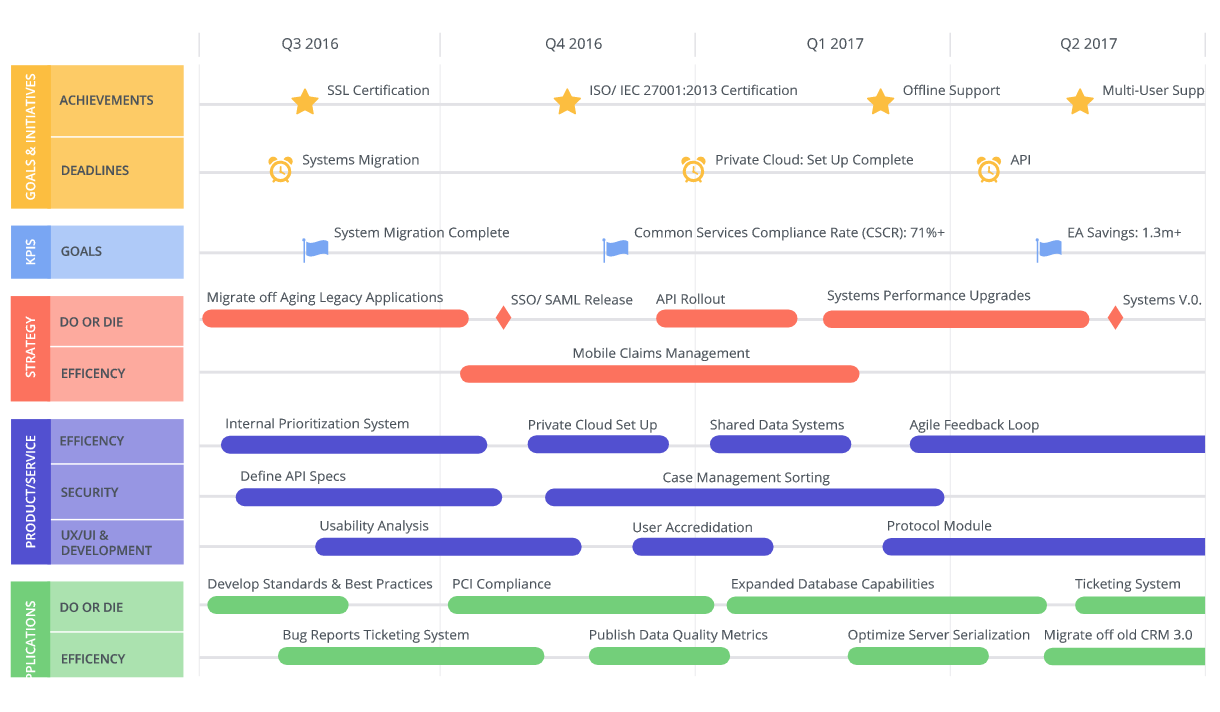
A roadmap communicates, measures, and improves your architecture with stakeholders more effectively and efficiently.
Concept Mapping
Blueprint
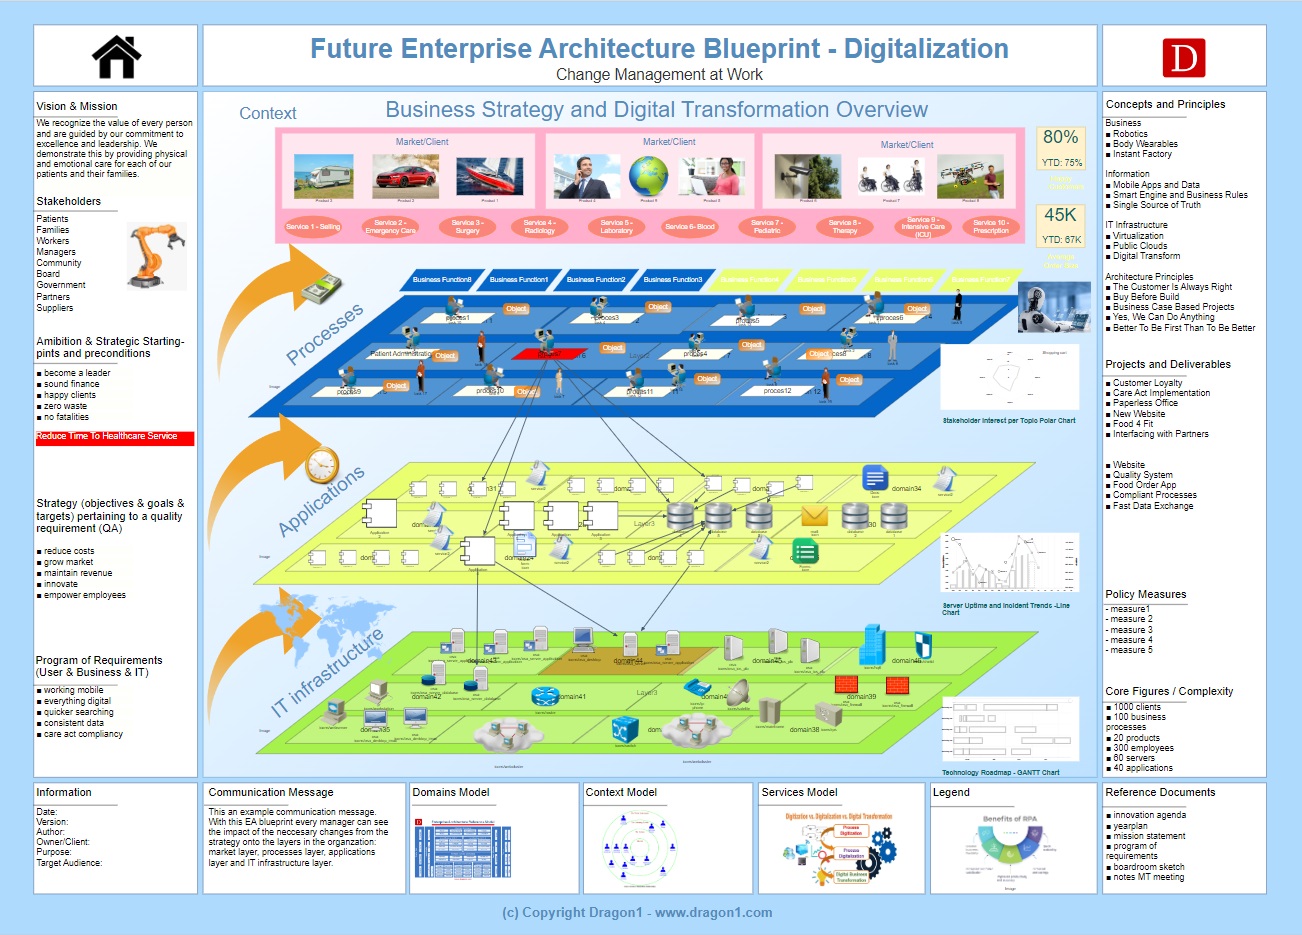
A blueprint visualizes the impact of changes made to processes, information systems, and IT infrastructures.
Landscape
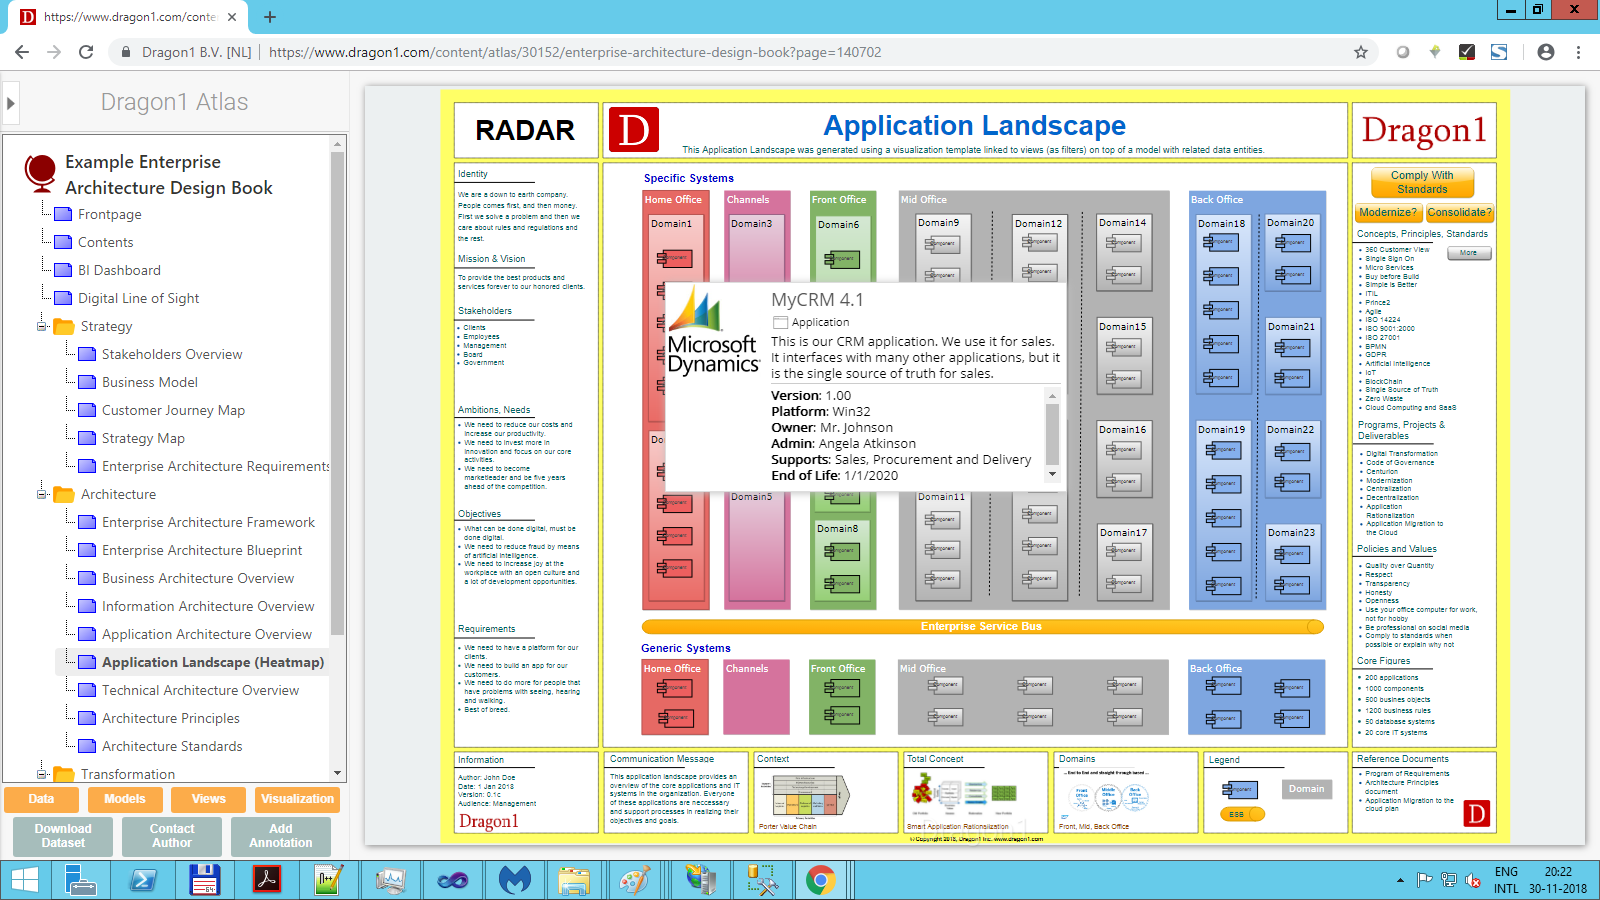
A landscape shows the logical and physical grouping, modularity, and functionality of applications, processes, services, etc.
Key Benefits of Mapping
By leveraging Dragon1 mapping capabilities, you can:
- Gain a clear and holistic view of your data
- Identify trends, outliers, and anomalies quickly
- Facilitate decision-making processes
- Communicate complex concepts and findings more effectively
- Collaborate with team members and stakeholders through interactive dashboards
- Uncover hidden patterns and correlations
- Present data in a visually appealing and engaging manner
Using Dragon1, mapping of data and information brings numerous advantages. It enhances valuable insights that spark innovation, improve processes, and boost overall business success.