Gap Analysis Matrices are diagrams and dashboards of essential value. Using Dragon1 software, you can generate a visualization using an Excel sheet, a template, and a JSON-API and focus on high-quality data, resulting in great analysis.
Above, you see an interactive example of a generated Gap Analysis in the Viewer. The Dragon1 Viewer is an application that can be used on dragon1.com/viewer, but it can also be embedded on any website or run locally on your laptop or server.
You can also have such a generated Gap Analysis Matrix by doing the Dragon1 Demo steps.
We have provided an Excel Sheet you can use to generate your own Gap Analysis Matrix with Dragon1.
Example Gap Analysis Matrix
You can make use of the buttons on the button bar to switch on and off a category of items.
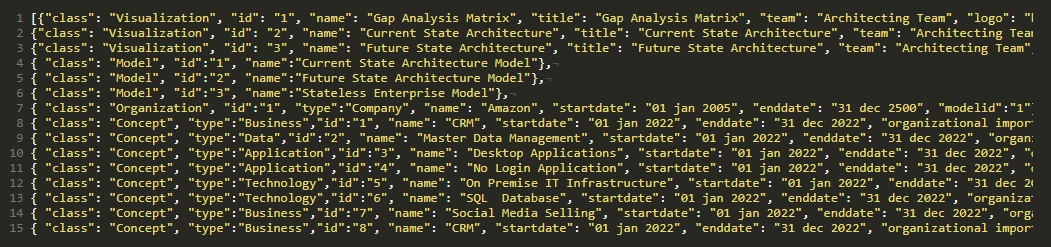
An example .dragon1 File:
Why Create a Free Trial Account?
Want to skip the step of converting an Excel sheet to JSON and upload the Excel sheet directly in the Viewer? Or do you want to store data in the Dragon1 repository? Create a trial account!
If you want to (re)use your company data professionally, you can upload the data to your paid user account. Go to the Online Store to purchase your Dragon1 PRO user license. If you would like to purchase paid user accounts for your team, please contact sales@dragon1.com.