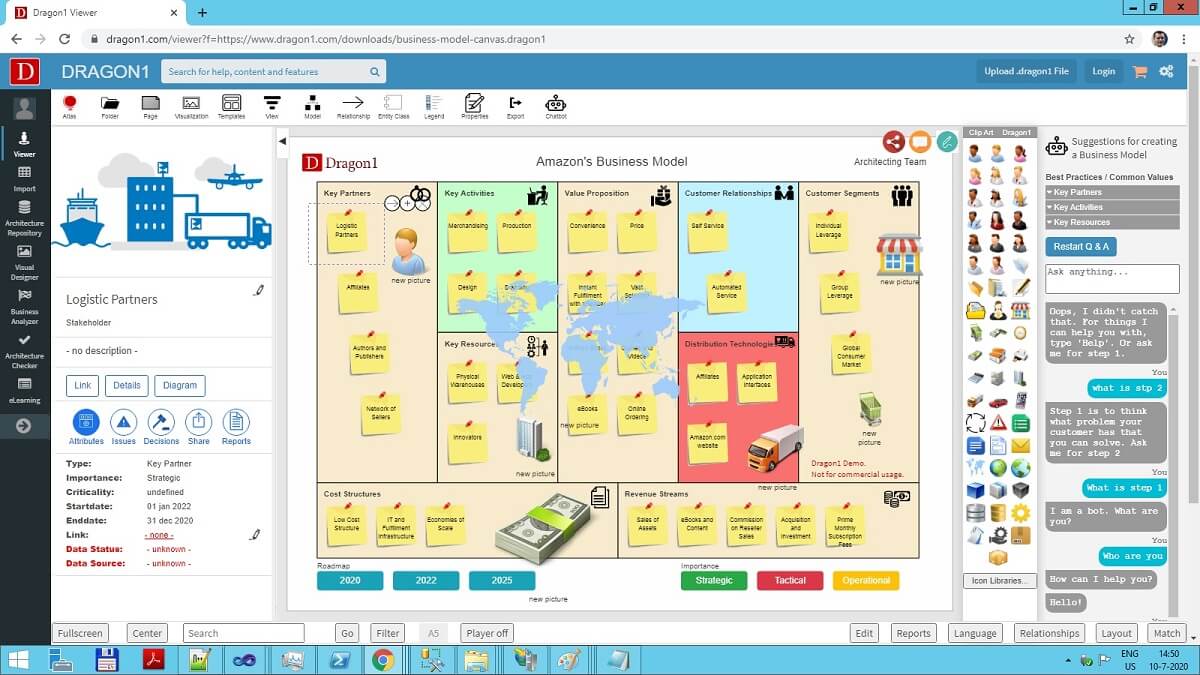
Next to the Dragon1 demos, we have provided a free tutorial for you on how to create and generate a business canvas model with a dashboard on Dragon1 and how to use it to manage your transformation.
An Excel Sheet demo
This demo is a diagram generation & analysis demo using the Business Model Canvas template.
We have provided an Excel Sheet you can use to generate your business canvas model on Dragon1.
You can use this canvas when you want to start a business. You can analyze the various aspects of your business model, using models from others or other models of your own architecture.
Measure - Analyze - Improve
Dragon1 supports you in measuring, analyzing, and improving your business model.
If you provide a reference business model canvas in your Excel Sheet, you can also compare and improve your business model with the reference model.
Dragon1 Demo
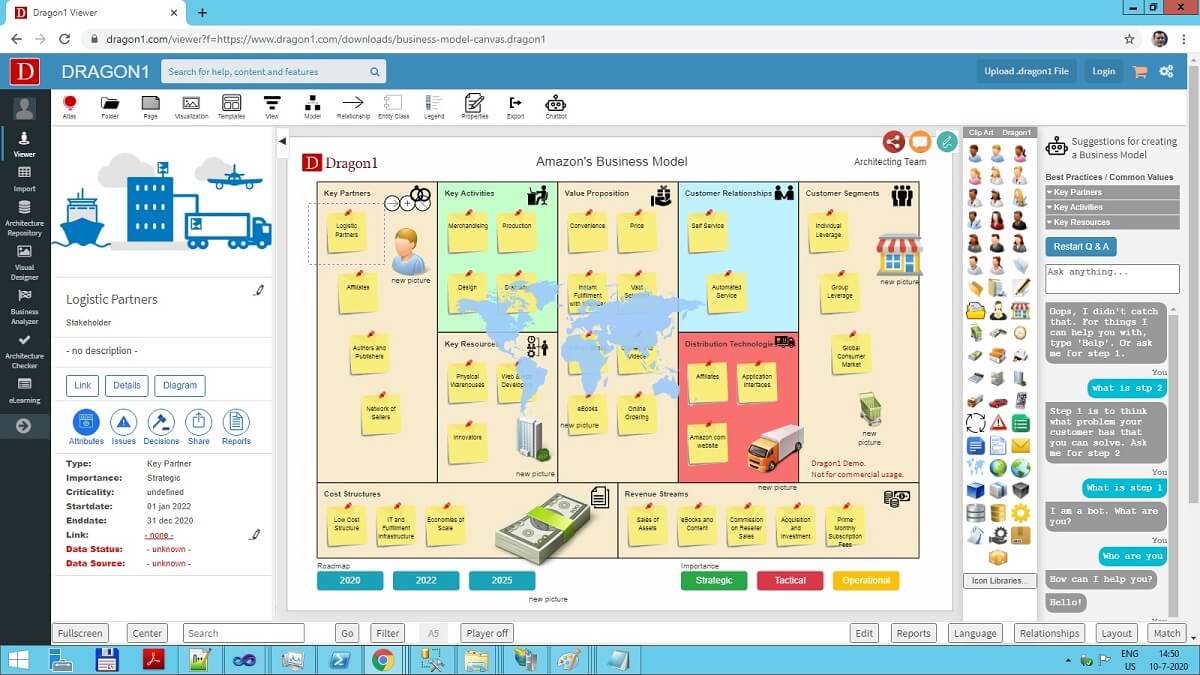
Below you see a static visualization of the diagram of Amazon's business model. You can use the button in the menu bar below to analyze the diagram and modify its appearance. The Layout button, for instance, helps you assign different colors to groups.
Do you want more details about the Business Plan Canvas Model? Download Business Model Generation [PDF] here.
Why Create a Free Trial Account?
Want to skip the step of converting an Excel sheet to JSON and upload the Excel sheet directly to the Viewer? Or do you want to store data in the Dragon1 repository? Create a trial account!
If you want to (re)use your company data professionally, you can upload the data to your paid user account. Go to the Online Store to purchase your Dragon1 PRO user license. If you would like to purchase more paid user accounts for your team, please contact sales@dragon1.com.


