If you want to follow our free tutorials in generating or building an Architecture Canvas Layouts from scratch, go to our Help Pages
This tutorial will provide some steps to edit, for example, the Architecture Canvas Layouts and dashboard in the Viewer (in edit mode).
Architecture Canvas Layout
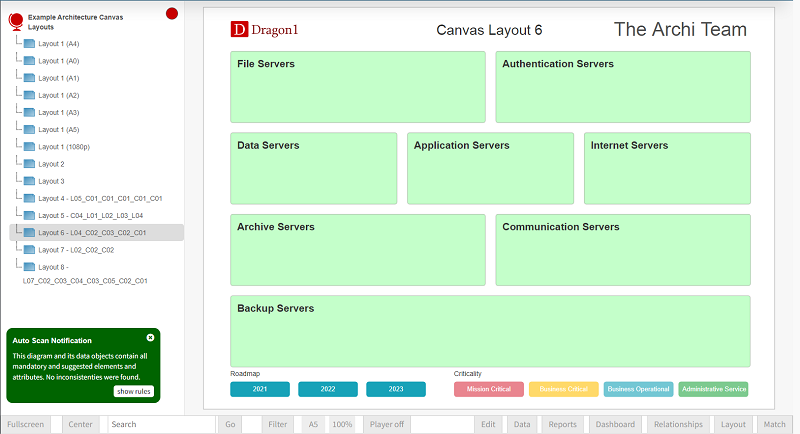
An Architecture Canvas Layout is an example layout of a Dragon1 canvas. A layout, in this case, is a set of areas spread out as layers or columns.
One of the layouts, which we name the Dragon1 Architecture Canvas, is presented above. With the Dragon1 demo steps, users can generate a visualization using a layout.
A layout consists of areas. An area on a canvas can be populated with a certain set of data from a repository or Excel sheet. For instance, an area can be populated with applications and another one can be populated with processes.
The layout can be configured by a user. Above, you see a dynamic example of a generated Architecture Canvas Layout in the Viewer.
We have provided an Excel Sheet you can use to generate your own Dragon1 Architecture Canvas Layout.
Why Create a Free Trial Account?
Want to skip the step of converting an Excel sheet to JSON and upload the Excel sheet directly in the Viewer? Or do you want to store data in the Dragon1 repository? Create a trial account!
If you want to (re)use your company data professionally, you can upload the data to your paid user account. Go to the Online Store to purchase your Dragon1 PRO user license. If you would like to purchase paid user accounts for your team, don't hesitate to get in touch with sales@dragon1.com.

