Create A Stakeholders Needs Requirements Analysis Diagram

What is a Stakeholder Model?

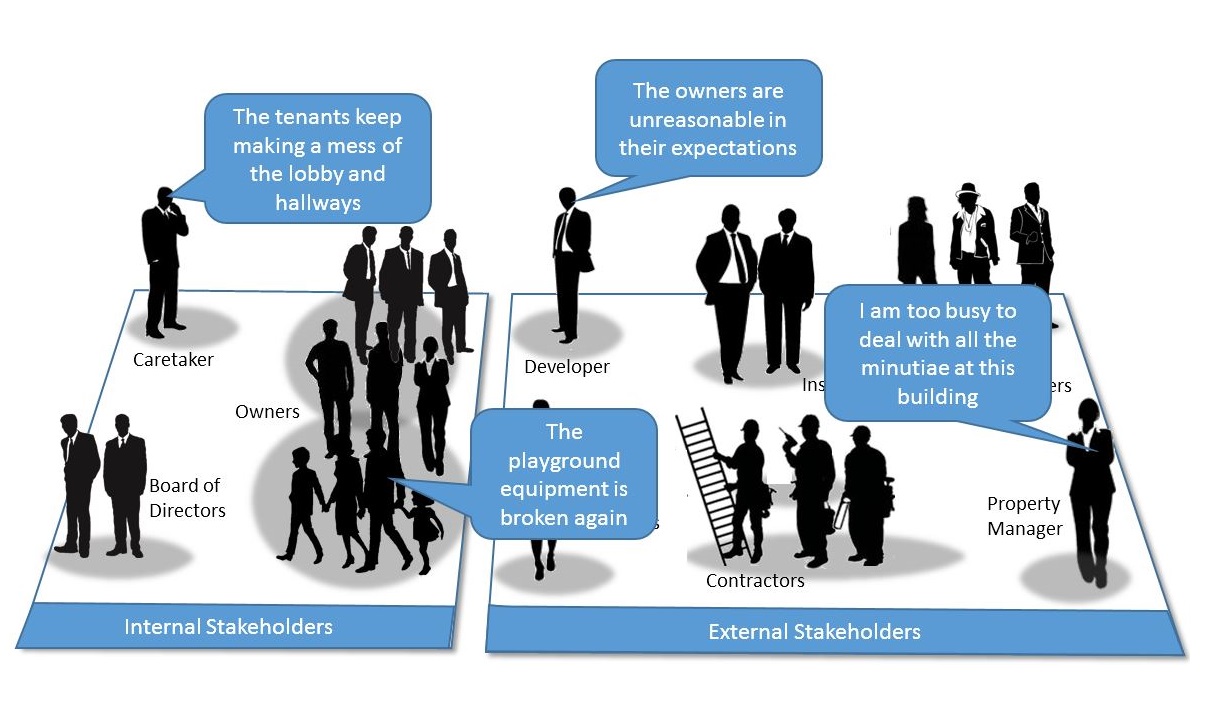
A stakeholders diagram shows which people and organizations have a certain stake in an organization.

This tutorial will introduce how to create a stakeholder analysis diagram.

The Dragon1 modeling language enables us to model stakeholders, needs, and requirements analysis in detail.

  • Stakeholders be modeled with...
  • Needs can be modeled with...
  • Requirements can be modeled with...

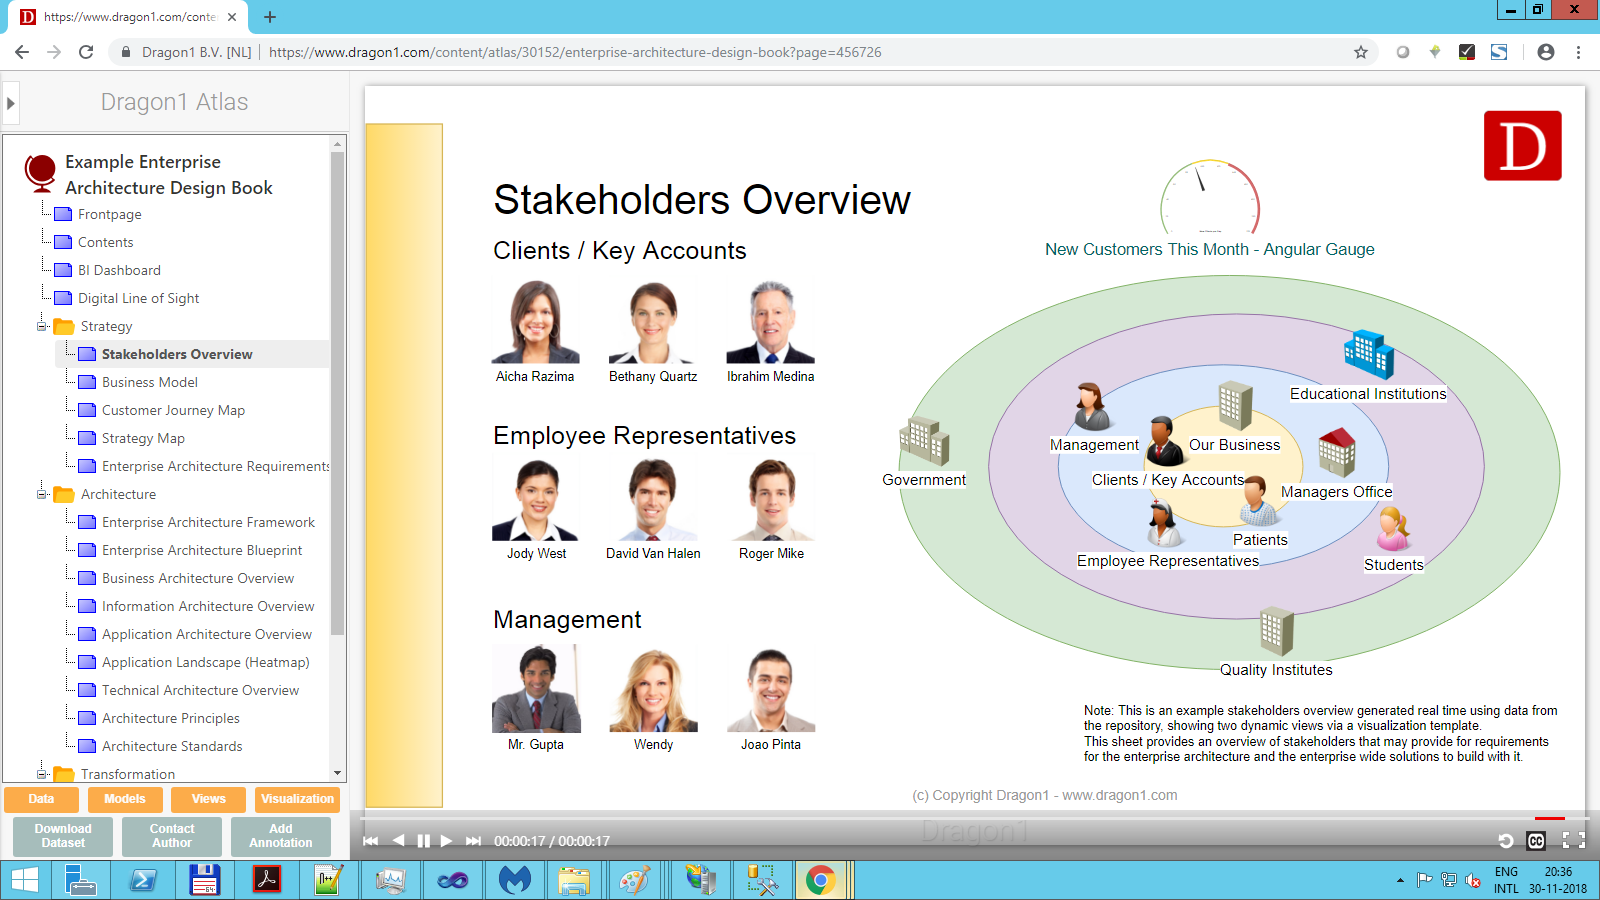
Example Stakeholder Onion Diagram

dragon1 stakeholder diagram

Stakeholder Onion Diagram.

The above visualization shows a stakeholder diagram. The relationships and rankings between the various stakeholders are shown.

An overview like this is necessary for any organization to rank the needs and requirements better (as they will cost time and money to realize).

You will create this diagram by using three web applications on Dragon1: The Architecture Repository, The Visual Designer, and The Viewer.

You will take the following steps

  • Create a dossier structure
  • Enter Data
  • Create process and application models, using the data
  • Create links between the process and application models
  • Create process and application views, using the models
  • Create links between views
  • Create a visualization, using the views
  • Publish the visualization to the Viewer to have it commented on by stakeholders

Introducing Dragon1

Dragon1 is a SaaS platform for co-creating and managing enterprise architecture.

It is a suite of web applications that can be used for creating interactive content and products like Enterprise Architecture, Business Models, Processes, Landscapes, Blueprints, and Roadmaps. In this tutorial, you will be using four web applications: Architecture Repository, Visual Designer, Viewer and Resource Center.

You can access each of these web applications by clicking on the corresponding label on the button bar above.

Architecture Repository

Create folder structures and enter data manually, enrich data or import data from files. Choose from 400+ entity classes.

Visual Designer

Create meta models, models, views and visualizations. Use templates and shape libraries. Create and reuse patterns.

Viewer

Watch the content created by your or others. Place comments onto the visualizations. Search, compare, and filter.

Resource Center

Create your own resource center or intranet. Publish your input documents, strategy, architecture, and transformation.

Step 1. - Create a Dossier Structure

First we are going to create a dossier structure in a cabinet to store our data.

To create a dossier structure

  • Go to the Visual Designer
  • Create or open a Cabinet
  • Select the cabinet in the Explorer treeview
  • Create a dossier
  • Create four folders in the dossier: Data, Model, View, and Visualization

Step 2. - Enter Data

On Dragon1 you can enter data by dragging shapes to a folder.

To enter data

  • Go to the Visual Designer
  • Create or open a Cabinet
  • Select a folder
  • Insert shapes from the Draw Archifact or Draw Entity dropdown menu
    • For the process-application landscape choose the shapes for three layers:
    • Business Layer: Group, Function, Process, Activity
    • Information Layer: Information Object
    • Application Layer: Application, Database, Interface, Service
  • Select a shape in the treeview
  • Select the shapes' icon on the canvas
  • Change the name of the shape at the right top in the text attributes of the Inspector

Step 3. - Create a Model, using the data

To create a model

  • Go to the Visual Designer
  • Create or open a Cabinet
  • Select a folder
  • Insert models from the menu bar
    • Create models for the process-application landscape for every entity class you have used
    • Process model, Service model, Application model, etc...
  • Enter a name for the model
  • Optionally choose a type for the model
  • Insert shapes like processes and applications for the model by clicking on Draw Archifact or Draw entity and drag shapes onto the canvas
  • You can change the color and size of the shapes
  • Draw connections between the shapes using the smart tools of a selected shape.

Step 4. - Create links between models

To create a link between models:

  • Select a model in the Explorer treeview
  • Select a shape in the model
  • Enter a link to another model in the LinkURL field of the text attributes

Step 5. - Create a View, using the model

To create a view

  • Go to the Visual Designer
  • Create or open a Cabinet
  • Select a folder
  • Insert views from the menubar
    • Create views for the process-application landscape for each model you created:
    • Functions view, Process view, and Activities view, etc...
  • Enter a name
  • Select the model to use
  • Enter a viewing rule for the model data:
    • Rule Event: onload
    • Rule Condition: Class=Process;Name=Sales;Relation=FirstLevel
    • Rule Action: Show(name)

Step 6. - Create links between views

To create a link between views:

  • Select a view in the Explorer treeview
  • Select a shape in the view
  • Enter a link to another view in the LinkURL field of the text attributes

Step 7. - Create a Visualization, using the views

To create a visualization

  • Go to the Visual Designer
  • Create or open a Cabinet
  • Select a folder
  • Insert a visualization from the menubar
  • Drag a shape on the canvas. You will use this shape to generate the view data on the canvas.
    • For the process-application landscape use three shapes:
    • One for Functions, Processes and Activities.
  • Save the visualization
  • Select one of the three view shapes
  • Enter the following view rules in the data attributes panel of the inspector.
    • Rule Event: onload
    • Rule Condition: Class=Process
    • Rule Action: Show(name)

Do this for all three view shapes

With this rule you will only see the processes from the view data. You can also show the whole view with Rule Condition = *.

Step 8. - Publish the visualization

To publish a visualization:

  • Select a visualization in a folder
  • Click on the Share button in the menubar
  • Enter the correct data in the dialog
  • Click on the share button in the dialog
  • Now go to the Viewer and search for your visualization by its title
  • Add a comment to the visualization
  • Filter the visualization on certain values

Read also

If you are interested in more examples of Landscape Diagrams you might also want to read:

  1. Visualizations > Process Landscape Diagram
  2. Visualizations > Process Application Landscape Diagram
  3. Solutions > Business Process Management
  4. Software > Dragon1 as BPM Tool
  5. Terms > Business Process Modeling Definition

Get Started

Do you want to start immediately? You can purchase your Dragon1 PRO user license here online via the Store.

If you do not have the time and you need a Stakeholders, Needs, and Requirements Diagram on short notice, we can create a diagram for you.