Animation
Dragon1 supports creating animated visualizations with a series of options. Animation adds movement to a visualization by employing successive drawings of objects.
Basic Animation
You get basic animation autogenerated as a feature on the Dragon1 platform.
How does it work?
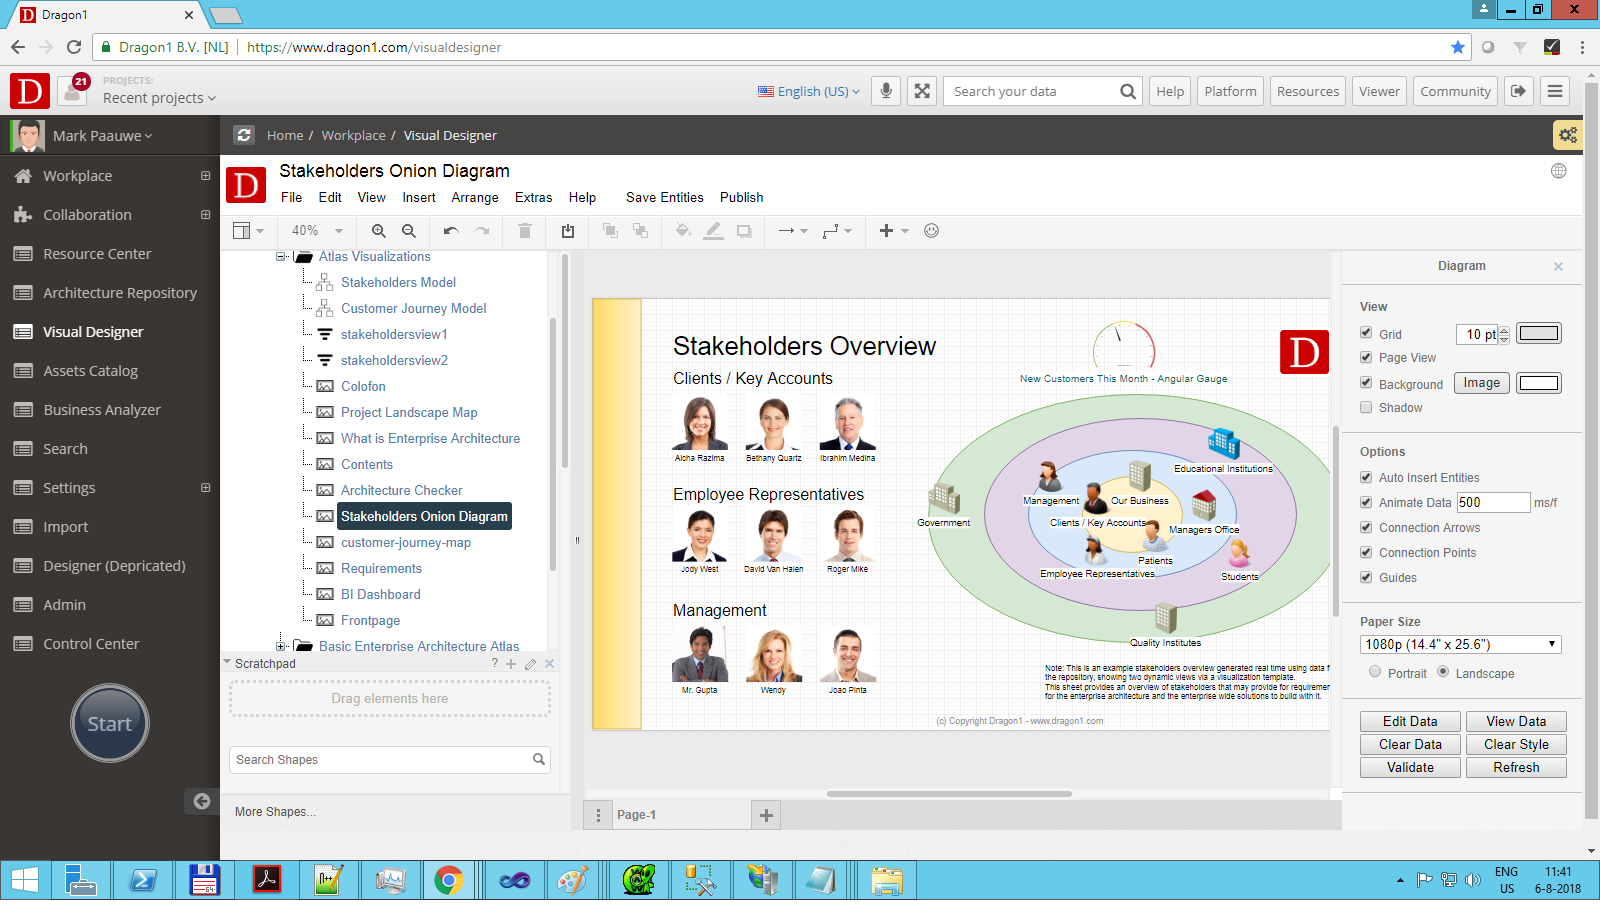
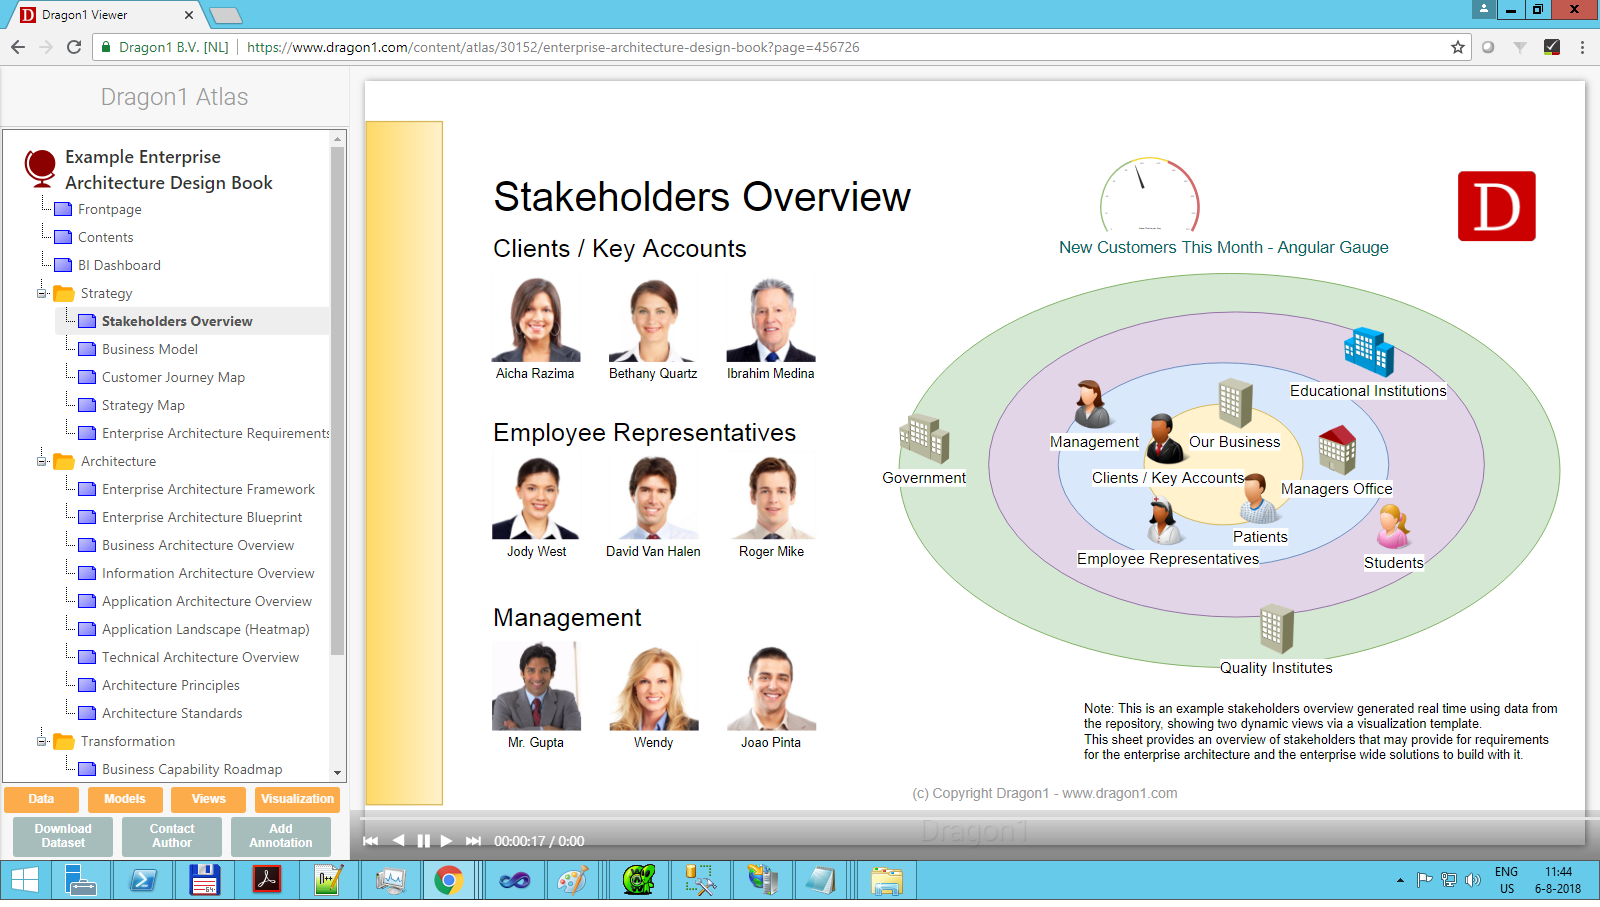
When you create a visualization and check the Animate Data option in the Visual Designer, the visualization, once published and viewed in the Viewer, will be shown shape by shape in an auto-generated order.
When you go with your mouse over a visualization in the Viewer, you see a player bar. Use the rewind button to restart your animation. Use the left and right arrow keys to view your animation step by step manually. Use the play button to automatically play the animation. Use the pause button to pause your animation and the fast-forward button to view the result.
If you do not want this animated behavior to start automatically, uncheck Animate Data and save your visualization.
Behind the Animate Data checkbox, you can provide a number for the frames per second the Viewer should show. This could be seen as the speed of the animation.
To see basic animation in action for the stakeholder diagram, click on the following Demo Stakeholder Map.
Adjusting The Shapes Animation Order
The Visual Designer supports providing a FrameNrStart and FrameNrEnd to each shape. With this, you can build up any animation scenario you would like.
You can access these attributes via the Edit Data menu item (in the context menu of a shape).
A frame is defined as the set of visible shapes at a certain time.
Use the menu item View --> Frames to access the Frames Window. Here, you can view the various frames in your visualization separately.
Animation Effects
The default animation effect is soft appear and soft disappear utilizing varying shape transparency.
Other effects you can choose for a selected shape are:
- Slide in left
- Slide in right
- Slide in top
- Slide in bottom
- Move from X1,Y1 to X2,Y2 via straight line or curve
- Position at X,Y
- Color of shape
- Size of shape
Advanced Animation
Dragon1 supports using strings of changes, rules, and indicators in an animation scenario.
How does that work?
Suppose you want to change the IT landscape and reduce the number of applications. However, you also have a policy rule that says every business process must always be supported with at least one core application.
You can build and play a scenario where you see if you breach this rule.
Or you can design several scenarios, let's say three, to see and evaluate the best way to migrate your application landscape.
To do this:
- First, you define an enterprise model in the Architecture Repository containing processes and applications.
- Next, you define a list of changes (a scenario) to the enterprise model. A change is an entity class that allows you to administer an Insert, Update, Delete, Merge, Split, and Group action to entities in a model.
- Each action you define can be animated/shown.
- Next, you can add Choices to a list of changes. For instance, if one entity or a couple of entities together have a certain computed value for an attribute, you might want to make a different change than otherwise.
- After creating the lists of changes and linking them to a visualization, you can play and watch them in the Viewer.
- Suppose that your list of changes (scenario) runs into a breach of a rule. You will see a visualization alert and hear an audio file.
More About Animation
If you want to know more about animation or do scenario analyses animation, you can visit this help page about Scenario Analyses Animation.


