Create a Gap Analysis Matrix
Analyze the Size of Gaps in your Company
In this tutorial, you will learn the steps of creating a Gap Analysis Matrix.
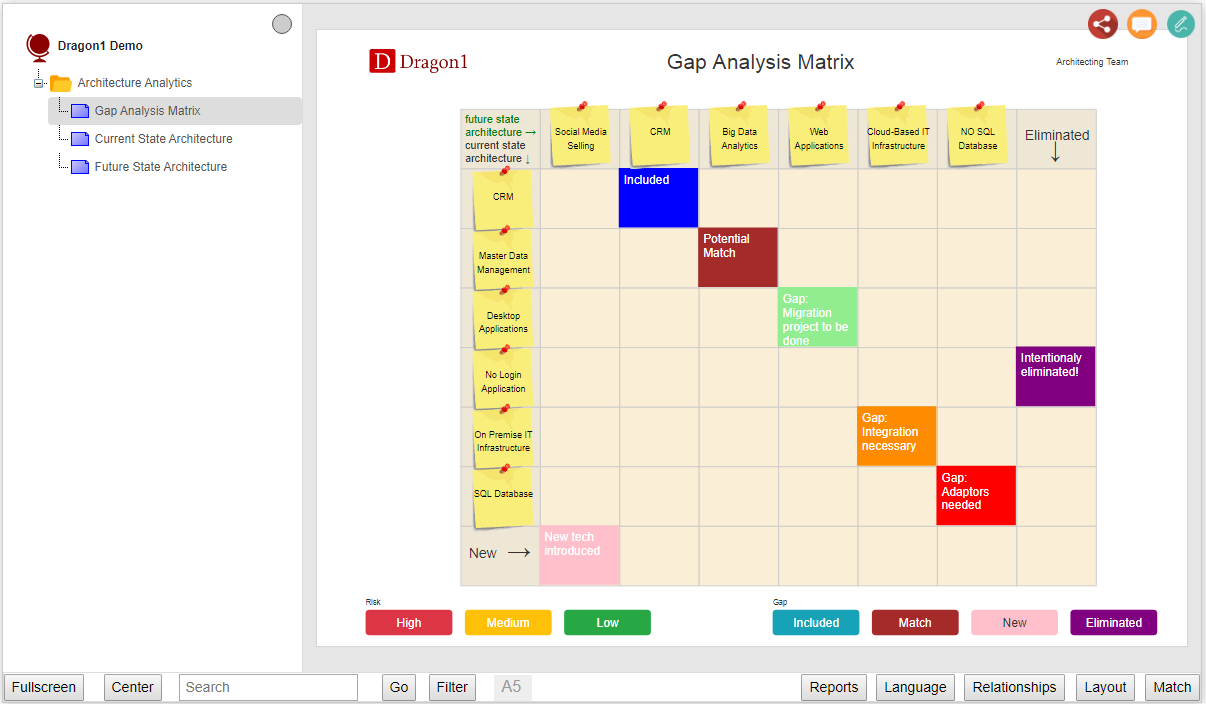
The Gap Analysis Matrix is a business analytics matrix for consultants and architects.
It is a visual map with an x-axis and y-axis and cells to record, measure, or describe the gap (distance) between two situations in an enterprise. For instance, the distance between a commercial department's current and future online sales capabilities.
This gap diagram is the perfect tool to help you analyze the size of gaps in a company.
Data Structure of a Gap Matrix
The data structure of the gap matrix is as follows:
- Data objects for the x-axis of the diagram
- Data objects for the y-axis of the diagram
- A model to relate the data objects
- Relationships, as parts of the model, define the gap between data objects.
- Definition of data objects for the X-axis and Y-axis
- Names for the labels of the X-axis and Y-axis
- Definition of the buttons at the bottom of the diagram (this is optional)
Creating and Generating Gap Matrices
You can create a matrix in the Viewer (in edit mode) or via the Data Dashboard.
- You can drag Post-it shapes onto the canvas.
- Be sure to drag at least two shapes to the canvas and create (draw) a relationship between them via the toolbar at the top-right of the shape. In the background, you make a model linked to this visualization.
- Click on one of the Post-it shapes. On the left side of the canvas, click on the name of the shape. Now, you can edit the name.
- Press TAB or click next to the input field to update the name of the shape in the visualization.
- Etc.


