How to Create a Roadmap
The tutorial will introduce three ways to create a roadmap, with an Excel sheet via the Upload, the Viewer, and the Data Manager.
In the steps below, we will use the Data Manager application as an example.
Roadmap Example
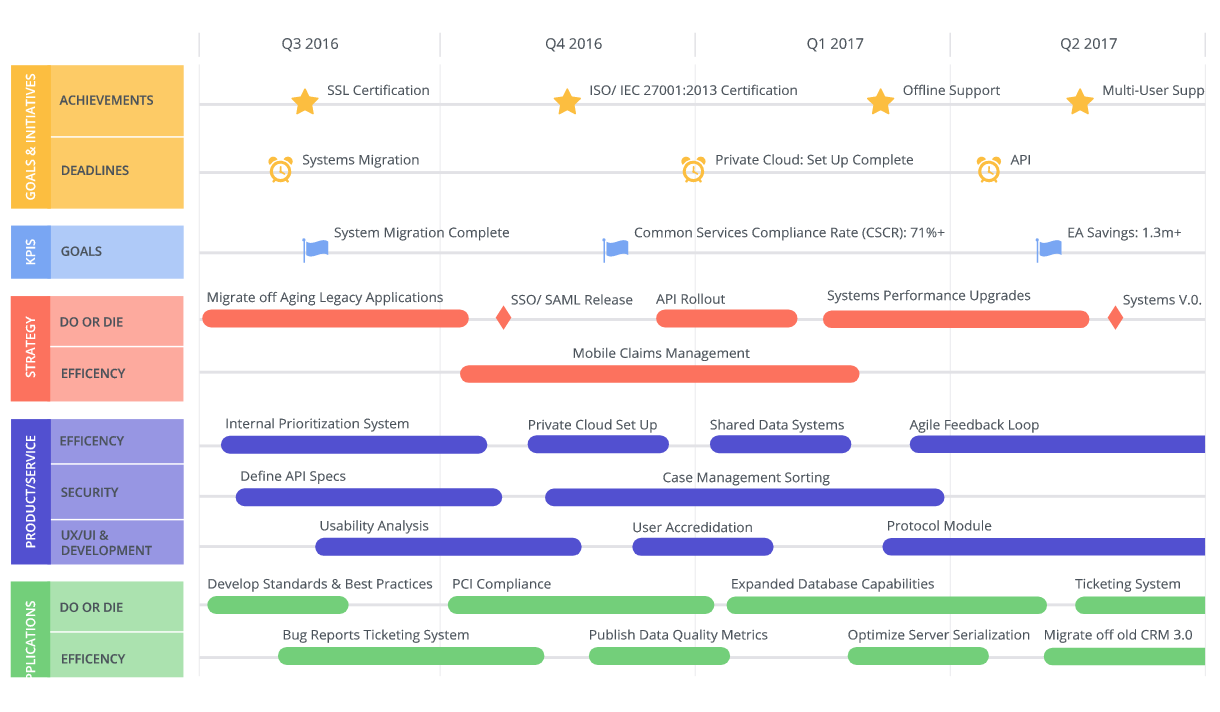
This visualization below shows an example of a roadmap (the internal name of this template is Roadmap).
Example of the Dragon1 Roadmap.
A roadmap like this helps you to create and communicate your architecture data with stakeholders more effectively and efficiently. Measuring and improving your architecture data and its relationships is also important.
Common Entity classes to use on a Roadmap are:
- Stakeholders and Actors
- Goals or Objectives
- Standards
- Business Components like Processes and Services
- Application Components like Applications and Interfaces
- IT Infrastructure Components like Servers and Clouds
- Start Date and End Date Events
Step 1. - Create an Atlas and atlas page
First, we are going to create an atlas.
To create an atlas:
- Go to the Data Manager application
- Click the entity class Atlas
- Click the Add button to add an Atlas
- Enter a name in the name field
- Click the Save button
Step 2. - Create an atlas page
Now, we are going to create an atlas page.
To create an atlas page:
- Go to the Data Manager application
- Click the entity class Atlas Page
- Click the Add button to add an Atlas Page
- Enter a name in the name field
- Select a visualization in the Image field
- Select an Atlas to link this Atlas Page to
- Set the publication status to 'published public' (so everyone logged into the account sees it).
- Provide a weight to specify the rank in the order of atlas pages
- If there is already a visualization created, select that visualization here.
- If you want this atlas page to be shown as a folder icon in the atlas, enter Folder in the type field
- Click the Save button
Step 3. - Create a Visualization
Next, we are going to a visualization.
To create a visualization:
- Go to the Data Manager application
- Click the entity class Visualization
- Click the Add button to add a Visualization
- Enter a name in the name field
- Enter the name in a different language in the title field
- Select a template: Roadmap
- Select a Page Size. f.i. A3
- If you set the visualization as published 'public', it will be shown as a separate visualization next to atlases in the Viewers overview.
- Add showLanguageButton(Translate) in the Action Script field.
- Click the Save button
Step 4. - Watch the Visualization in the Viewer
Now we will watch the visualization in the Viewer.
To watch the visualization in the Viewer:
- Go to the Viewer application
- Click on the Atlas image
- Click on the Atlas page in the treeview of the Atlas
- Click on the translate button to toggle between the diagram titles
Step 5. - Create a Model
To create a model:
- Go to the Data Manager application
- Click on the entity class Model
- Add a name for the model
- Click on Save
- Go to the Data Manager application
- Click on the entity class Visualization
- Select the added model for the visualization (this will cause all the data that is part of the model to be shown on the canvas.
- Click on Save
Step 6. - Add Applications, Servers and Standards
To create add a process:
- Go to the Data Manager application
- Click on the entity class Applications
- Add a name for the application
- Click on Save
Repeat this for other data you want to enter
Step 7. - Add Relationships
To create add a relationship:
- Go to the Data Manager application
- Click on the entity class Application
- Select an application
- Click on Add Relationship
- Select the added model
- Select an entity class and an entity instance
- Click on Save
Repeat this for other data you want to create relationships for.
Step 8. - Watch the End Result
Go to the Viewer application again and watch the result.
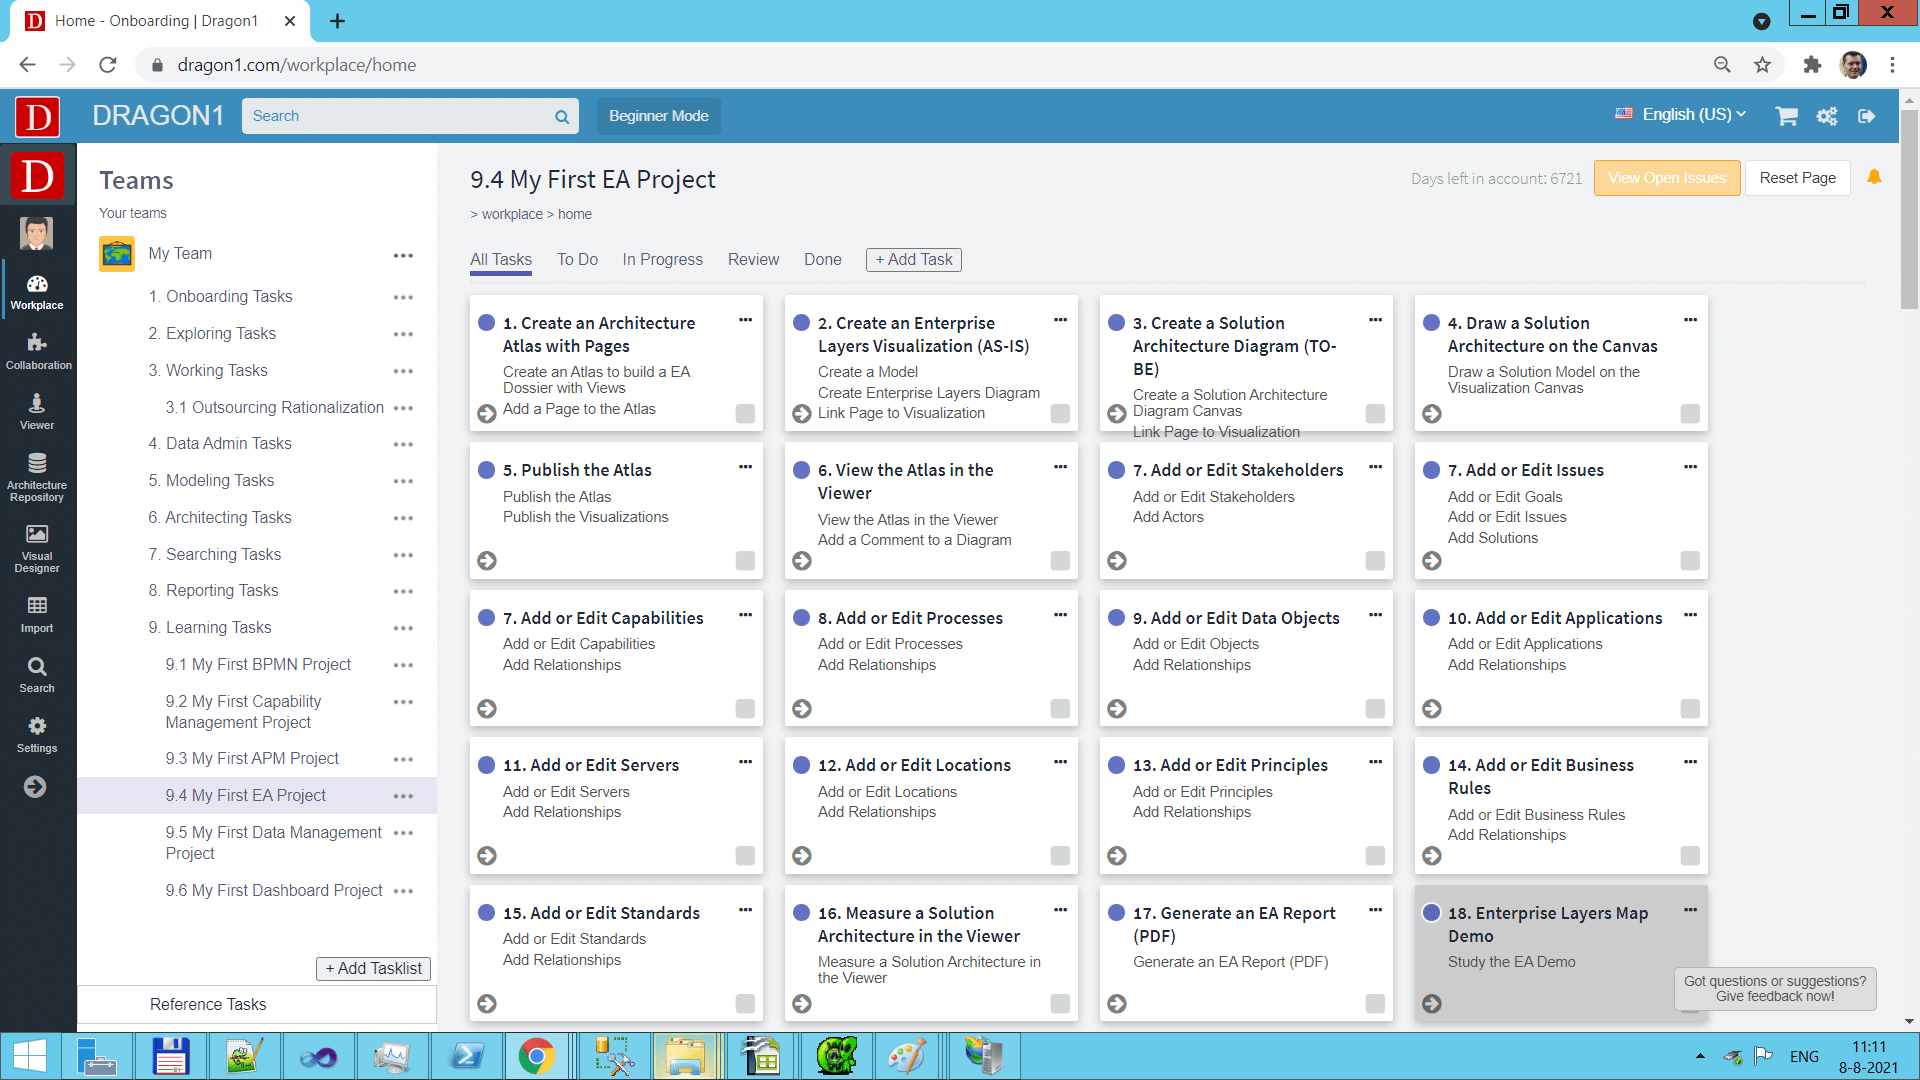
Screenshot of a task board to create and populate a Roadmap.
Create your Roadmaps with the Viewer or Upload an Excel Sheet. Log in or sign up for a free trial today.


