Create A Data Lake Architecture

What is a Data Lake?

A data lake is a method of storing data within a system or repository, in its natural format, that facilitates the collocation of data in various schemata and structural forms, usually object blobs or files.

A Tutorial on Data Lake Architecture

Here on the Dragon1 platform you can, with one click of a button, create a data lake architecture visualization. Next, adjust the template to your situation. Or you can start from scratch and make use of the data lake building blocks/symbols to create your unique data lake architecture within a few moments.

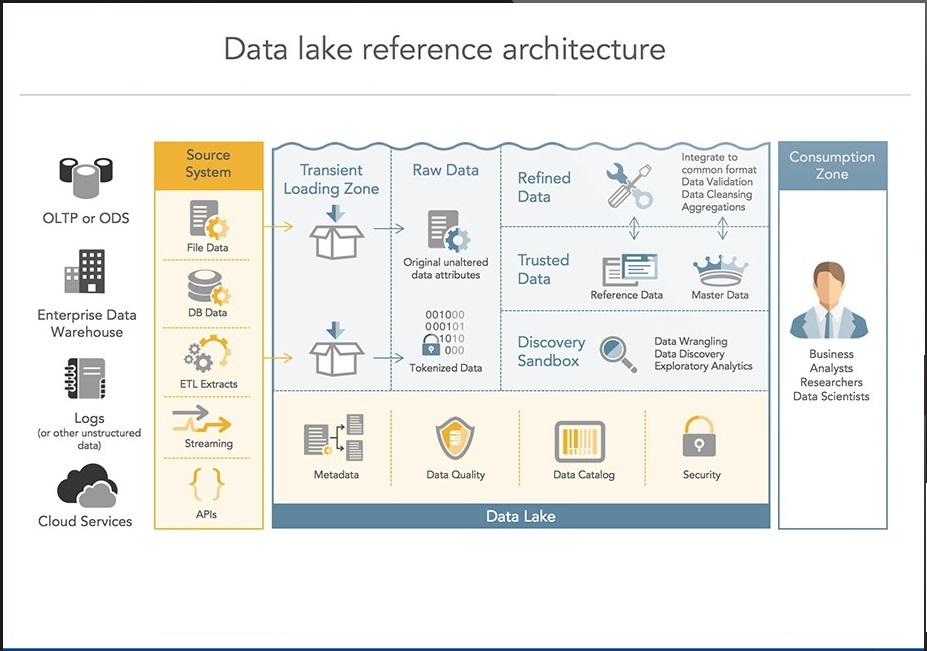
We have provided the Zaloni Data Lake Reference Architecture as a template for you on Dragon1.

data lake reference architecture

This visualization shows a Data Lake Architecture.

An overview like this is necessary for any organization.

You will create this architecture by using one web application on Dragon1: the Visual Designer.

You will take the following steps

  • Create a dossier structure
  • Enter Data
  • Create process and application models, using the data
  • Create links between the process and application models
  • Create process and application views, using the models
  • Create links between views
  • Create a visualization, using the views
  • Publish the visualization to the Viewer to have it commented by stakeholders

Introducing Dragon1

Dragon1 is a SaaS platform for co-creating and managing enterprise architecture.

It is a suite of web applications that can be used for creating interactive content and products like: Enterprise Architecture, Business Models, Processes, Landscapes, Blueprints and Roadmaps. In this tutorial you will be using four web applications: Architecture Repository, Visual Designer, Viewer and Resource Center.

You can access each of these web applications by clicking on the corresponding label on the button bar above.

Step 1. - Create a Dossier Structure

First we are going to create a dossier structure in a cabinet to store our data.

To create a dossier structure

  • Go to the Visual Designer
  • Create or open a Cabinet
  • Select the cabinet in the Explorer Treeview
  • Create a dossier
  • Create four folders in the dossier: Data, Model, View and Visualization

Step 2. - Enter Data

On Dragon1 you can enter data by dragging shapes to a folder.

To enter data

  • Go to the Visual Designer
  • Create or open a Cabinet
  • Select a folder
  • Insert shapes from the Draw Archifact or Draw Entity dropdown menu
    • For the process-application landscape choose the shapes for three layers:
    • Business Layer: Group, Function, Process, Activity
    • Information Layer: Information Object
    • Application Layer: Application, Database, Interface, Service
  • Select a shape in the treeview
  • Select the shapes' icon on the canvas
  • Change the name of the shape at the right top in the text attributes of the Inspector

Step 3. - Create a Model, using the data

To create a model

  • Go to the Visual Designer
  • Create or open a Cabinet
  • Select a folder
  • Insert models from the menu bar
    • Create models for the process-application landscape for every entity class you have used
    • Process model, Service model, Application model, etc...
  • Enter a name for the model
  • Optionally choose a type for the model
  • Insert shapes like processes and applications for the model by clicking on Draw Archifact or Draw entity and drag shapes onto the canvas
  • You can change the color and size of the shapes
  • Draw connections between the shapes using the smart tools of a selected shape.

Step 4. - Create links between models

To create a link between models:

  • Select a model in the Explorer Treeview
  • Select a shape in the model
  • Enter a link to another model in the LinkURL field of the text attributes

Step 5. - Create a View, using the model

To create a view

  • Go to the Visual Designer
  • Create or open a Cabinet
  • Select a folder
  • Insert views from the menubar
    • Create views for the process-application landscape for each model you created:
    • Functions view, Process view and Activities view, etc.
  • Enter a name
  • Select the model to use
  • Enter a viewing rule for the model data:
    • Rule Event: onload
    • Rule Condition: Class=Process;Name=Sales;Relation=FirstLevel
    • Rule Action: Show(name)

Step 6. - Create links between views

To create a link between views:

  • Select a view in the Explorer Treeview
  • Select a shape in the view
  • Enter a link to another view in the LinkURL field of the text attributes

Step 7. - Create a Visualization, using the views

To create a visualization

  • Go to the Visual Designer
  • Create or open a Cabinet
  • Select a folder
  • Insert a visualization from the menubar
  • Drag a shape on the canvas. You will use this shape to generate the view data on the canvas.
    • For the process-application landscape use three shapes:
    • One for Functions, Processes and Activities.
  • Save the visualization
  • Select one of the three view shapes
  • Enter the following view rules in the data attributes panel of the inspector.
    • Rule Event: onload
    • Rule Condition: Class=Process
    • Rule Action: Show(name)

Do this for all three view shapes

With this rule you will only see the processes from the view data. You can also show the whole view with Rule Condition = *.

Step 8. - Publish the visualization

To publish a visualization:

  • Select a visualization in a folder
  • Click on the Share button in the menubar
  • Enter the correct data in the dialog
  • Click on the share button in the dialog
  • Now go to the Viewer and search for your visualization by its title
  • Add a comment to the visualization
  • Filter the visualization on certain values

It is also worth checking out the Data Architecture reference model and reading more about the Data Architecture Prinicples in the Resources section.