How To Create An IT Landscape Diagram
Creating IT Landscapes with ease
This tutorial will help you create and generate an IT Landscape in three ways: via the Viewer, Excel Sheets, and the Data Manager.
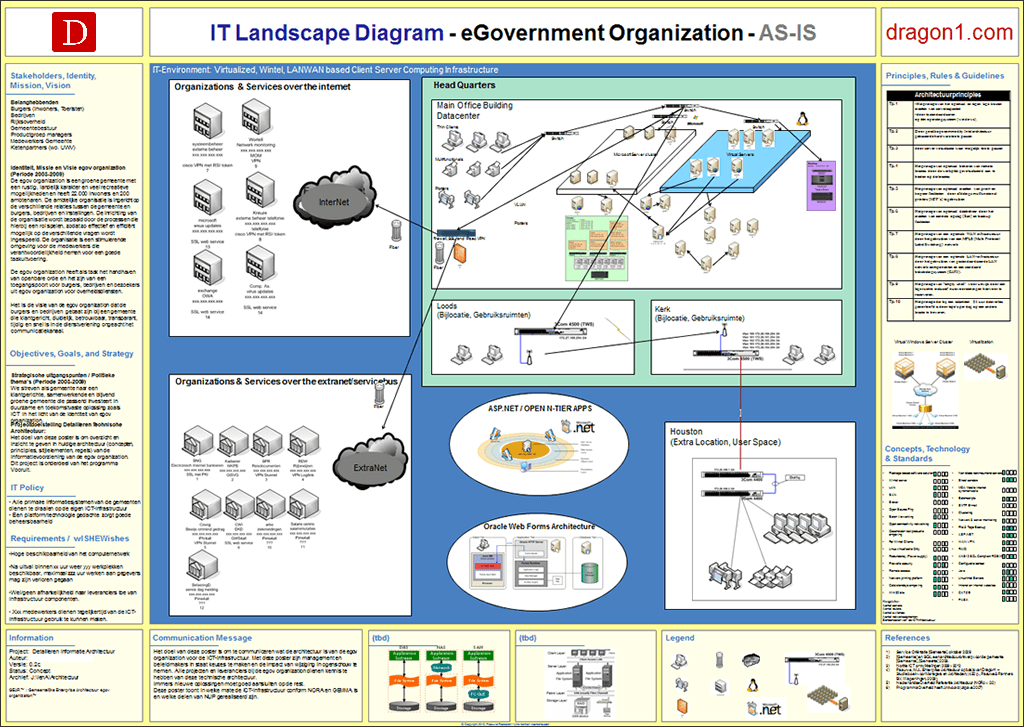
An IT Landscape shows how the IT services are grouped, structured, and delivered by IT components. It presents a technical view of IT supported with a functional view of IT, plus the IT architecture principles and IT standards that ensure the quality of the IT Landscape.

In 14 steps, create your IT Landscape in the Dragon1 Workplace.
Having an overview helps to control resources and costs
If an organization loses the overview of the IT Landscape, the costs and resources needed to solve problems will increase dramatically. Also, quick fixes are often implemented instead of sustainable solutions. It pays to maintain an up-to-date IT landscape at all times.
Removing legacy systems successfully
Implementing new applications, updating systems to the new version, or even cloud migration is not as hard as removing legacy systems.
Replacing old systems without having an overview beforehand of how everything is structured and connected, and where dependencies are likely to run into showstoppers.
First, a few dependencies must be solved before the legacy systems can be removed from the equation.
Having an updated IT Landscape helps to see the system's interfaces and dependencies.
The parts of an IT Landscape architecture
An IT Landscape shows how the IT services are grouped, structured, and delivered by IT components.
It presents a technical view of IT supported with a functional view of IT.
An IT Landscape shows an organization's core and vital IT assets, the computer and network software, and hardware set, plus 'connected' things in a specific configuration, grouped by domains.
An IT Landscape shows how the business operation of an organization is supported with IT services.
A best practice is to visualize the structures in the domains and groups in layers.
To sum up the key parts of the IT Landscape architecture:
- IT User groups
- IT Users (internal and external)
- IT Service groups
- IT Services (internal and external)
- IT Domains
- IT Components (internal and external/outsourced)
- Locations
- Networks
- Clouds
- Computers
- Operating systems
- IoT devices
- Storage and archiving devices
- Other devices
- Software systems and applications
- System and application interfaces
- IT Architecture Principles
- IT Standards
Practical IT Landscape Stakeholder Benefits
IT Landscapes have different benefits for different stakeholders.
- It helps directors to be in control of service quality
- It helps architects to plan changes better
- It helps managers to be in control of the execution of changes
- It helps technicians to solve problems quickly and sustainably
- It helps projects work better together
- It helps auditors and security roles maintain a higher level of cybersecurity

