Generate a Visualization
On Dragon1, a user can generate a visualization. This is done by going to the Architecture Repository, inserting visual items on a visualization canvas, and setting up the visual items. Hence, they show a selection of data from a view or model in pattern, size, and color.
Follow the steps below to generate your visualization.
What is a visualization? - A visualization is a graphical representation of a view of a model. A visualization consists of a canvas on which visual items are placed.
The steps for generating a visualization
- Startup the Architecture Repository web application
- Open a Cabinet
- Select a folder in a dossier
- Insert several entities: for instance:
- 3 processes (procurement, production, and sales),
- 3 applications (BuyOnline, ProdSys, CRM)
- three servers (SRV1, SRV2, SRV3)
- or import data from a file
- Insert a model: 'My Enterprise Model 2018-2025.'
- Create relationships between the entities and link them to the model: read create a model
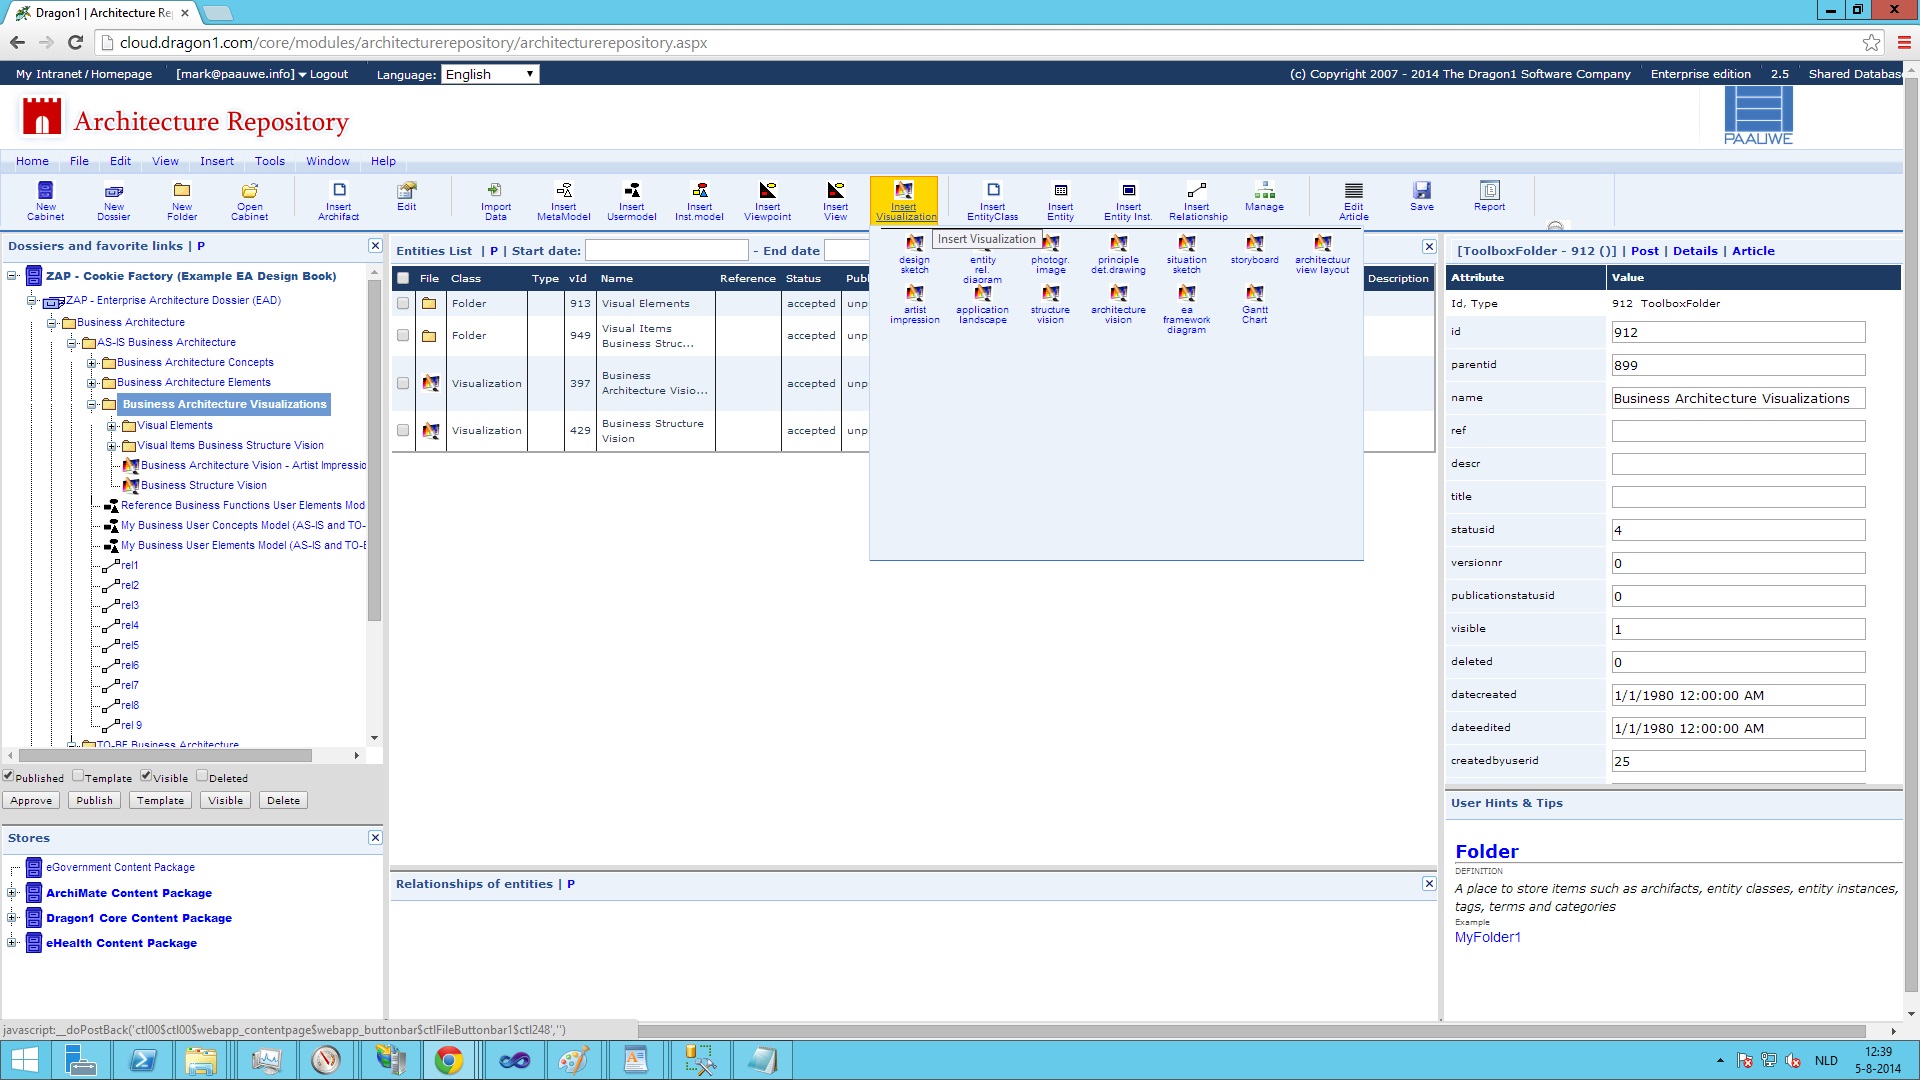
- Click the Insert Visual Item button on the menubar. Now the New Edit Dialog appears
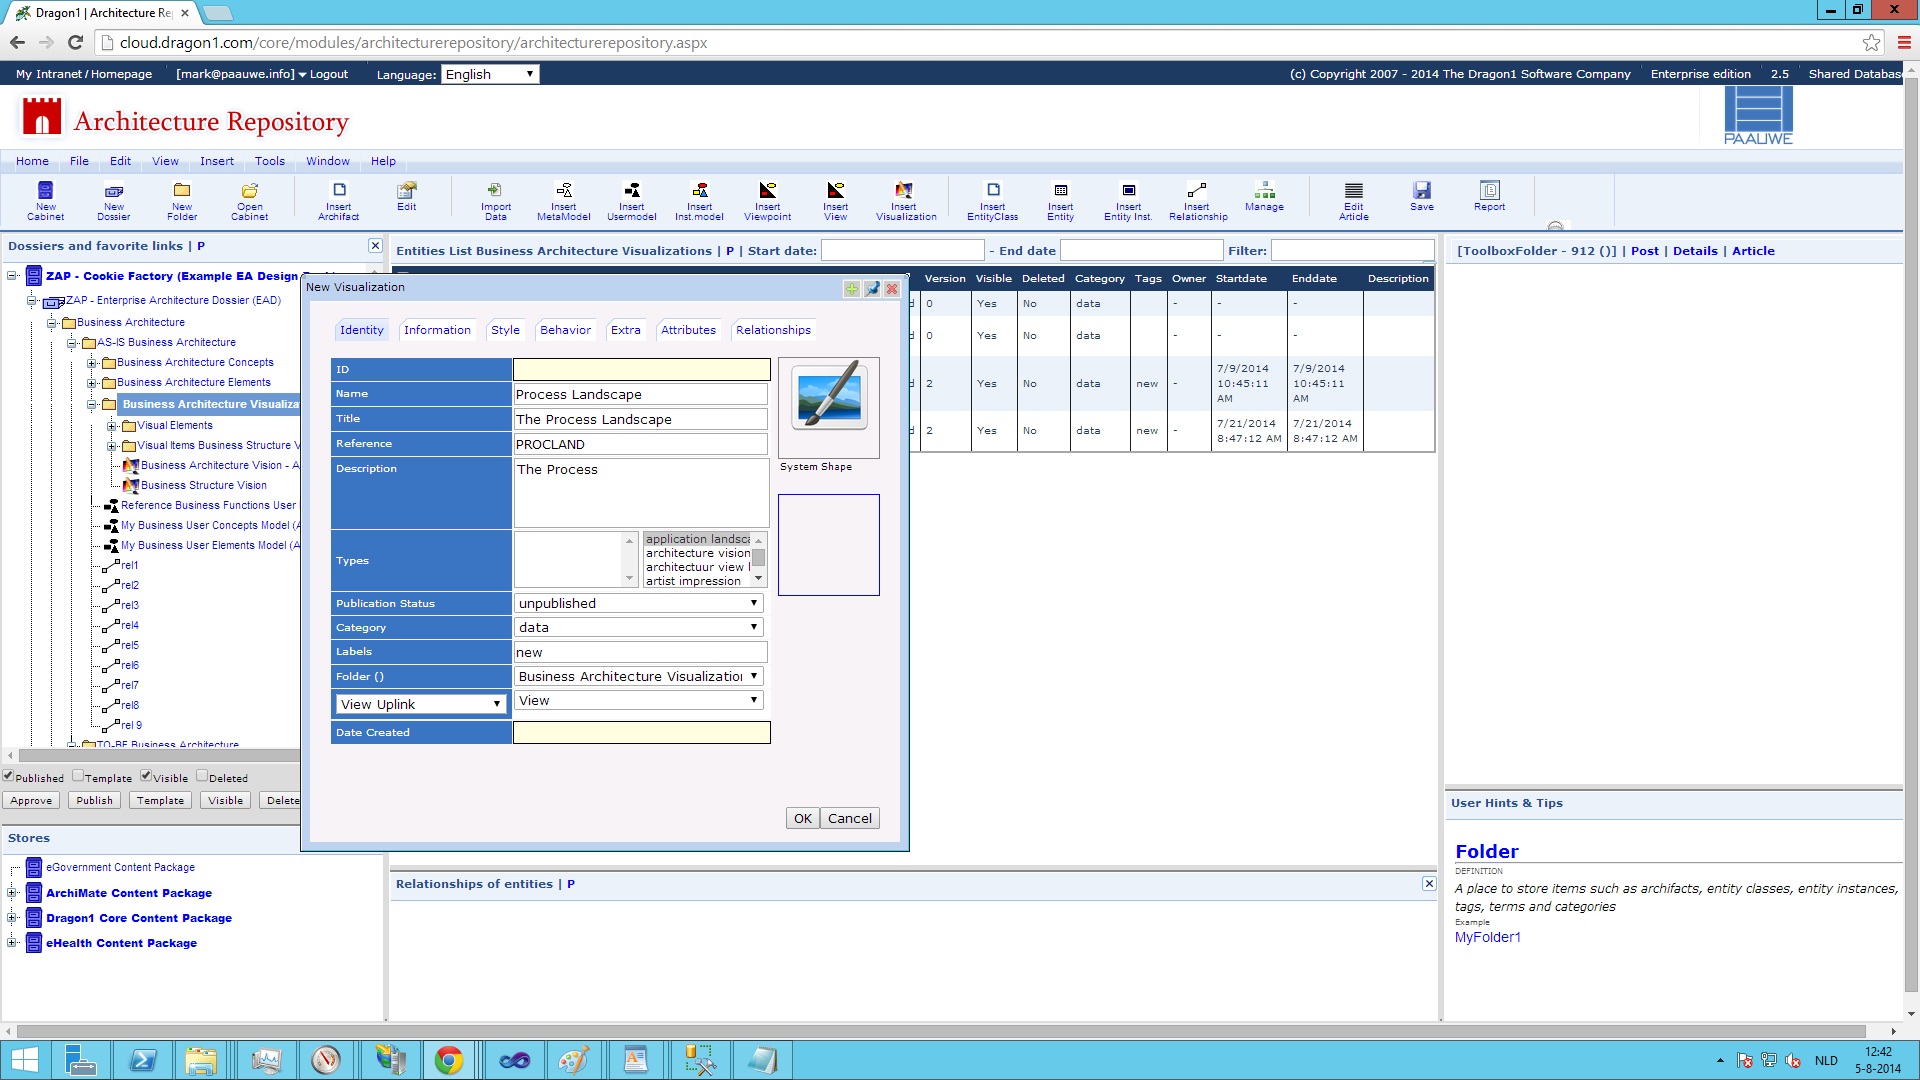
- Enter at least the name of the visual item and select the visualization to link the visual item to
- Select on the second tab a shape and check the dynamic link
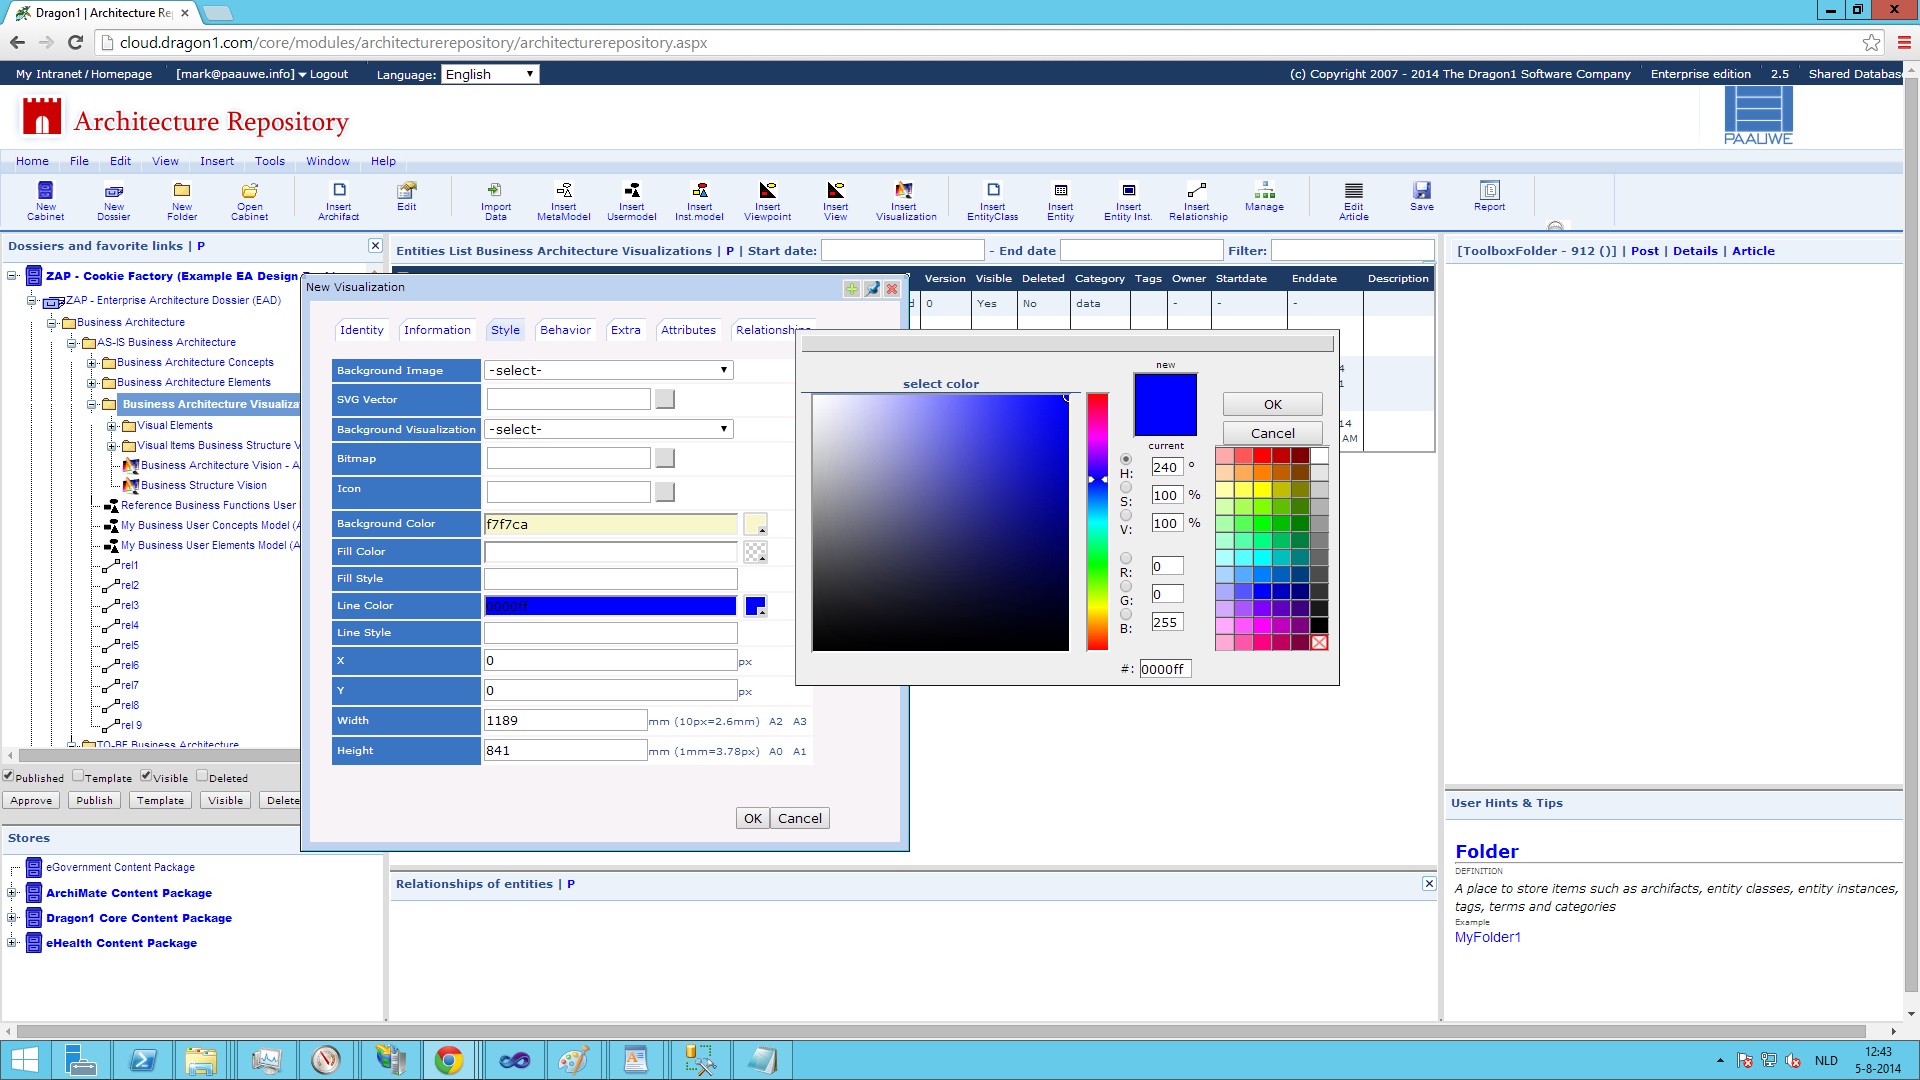
- On the third tab, select background and foreground color and the mode
- On the fourth tab, set the rule for the visual item
- The rule event on 'visualizationload'
- The rule condition on ...
- The rule action on ... color shape orange if the cost of application above 50k else colors green and color process red if no owner else colors green.
- On the fifth tab, select a draw pattern and set the rows, cols, and interval
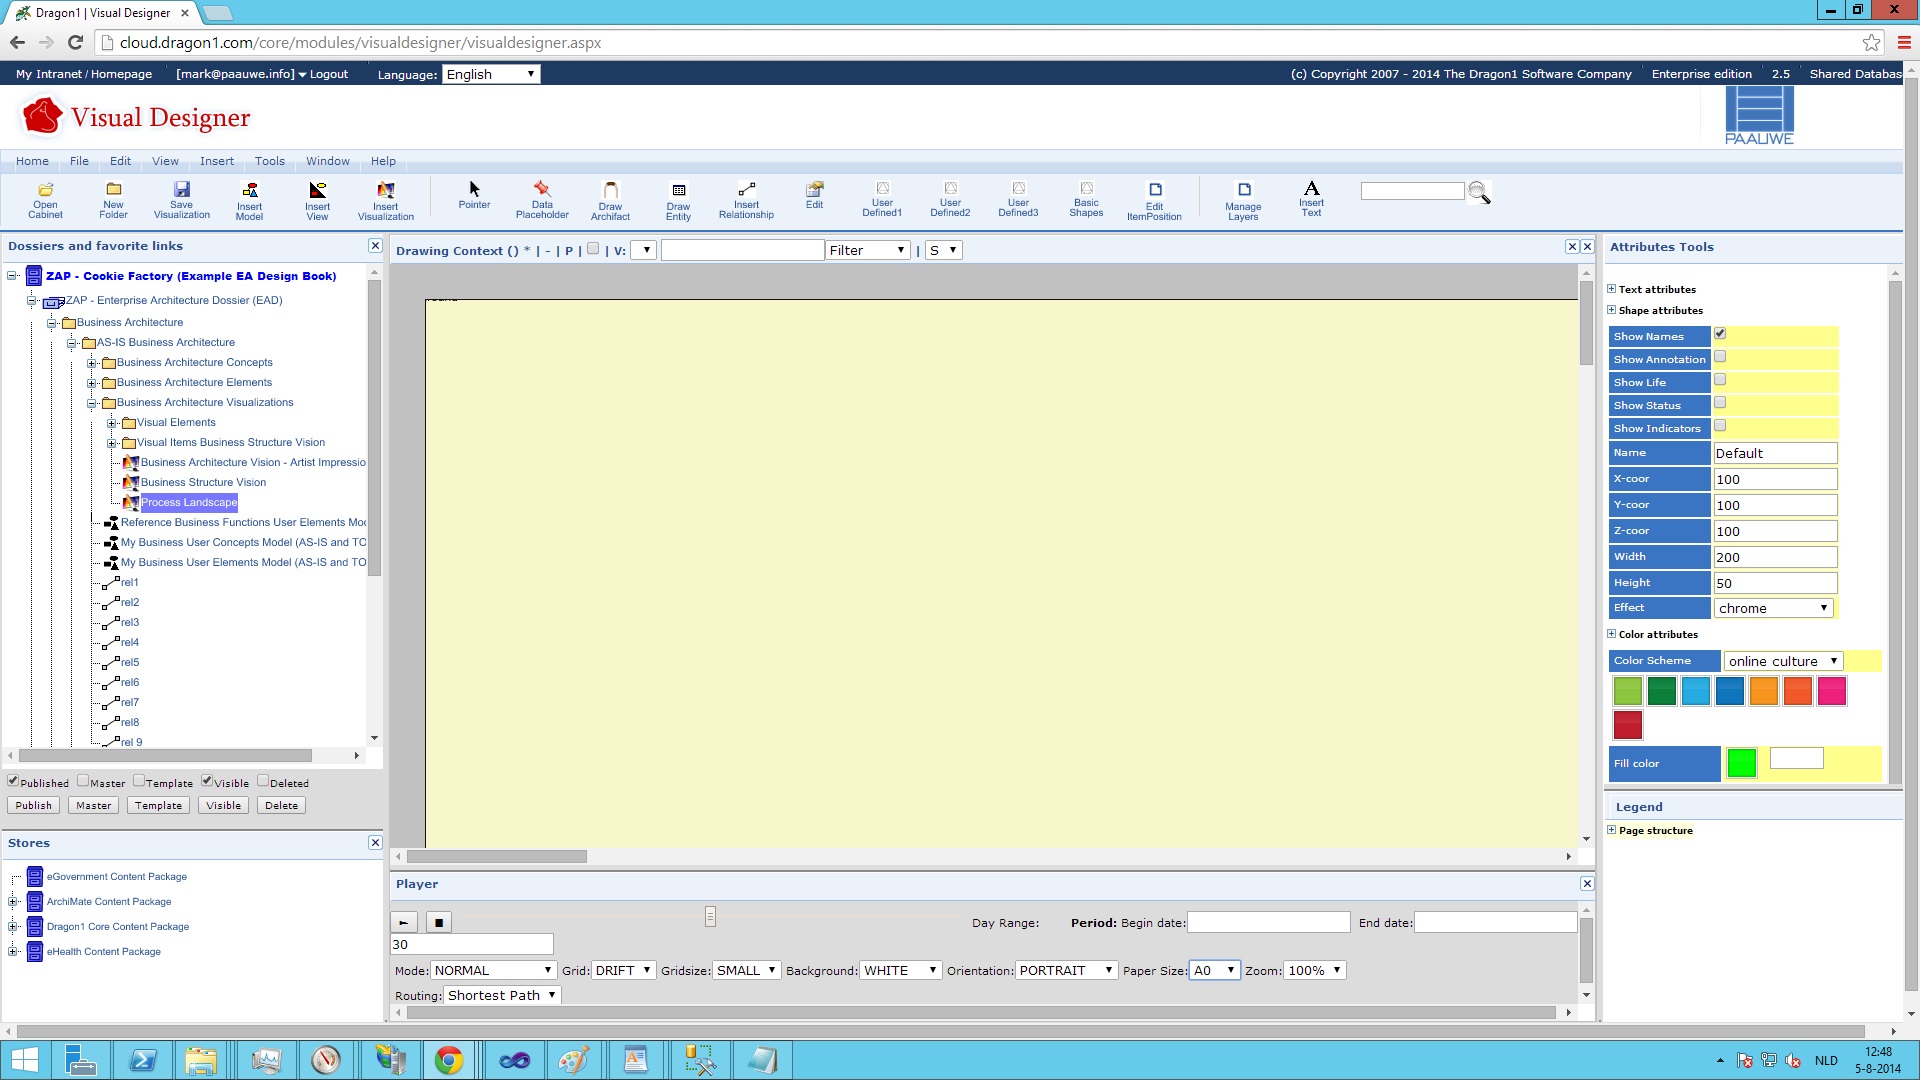
- If you go to the Visual Designer web application, open the cabinet, select the visualization, and select normal mode, you see a visualization with visual items interpreted for the linked data.
Application Screenshots of the Dragon1 software to show the steps

Figure 1. - Screenshot of the Architecture Repository web application with the 'Insert Visualization'- menu selected.


