Create a Button on a Visualization
Dragon1 supports creating buttons on visualizations.
Buttons are visual objects (shapes) that can be clicked on, and action script is executed.
Placing a Button on a Visualization in the Viewer
If you want to place a button onto a visualization, select a rounded rectangle or other shape in the icons bar and drag it onto the canvas.
Next, you style it with a background color, gradient, or shadow to a button shape.
To change the color of the background, select the shape and click the properties menu button.
The rounded rectangle also has a shape handle (yellow dot) for fine-tuning its shape.
Configuring a Button Click in the Viewer
To make a button act on a click, we need to add an ActionScript function.
Upon click on the button, the actionscript is executed.
To add the actionscript function, do:
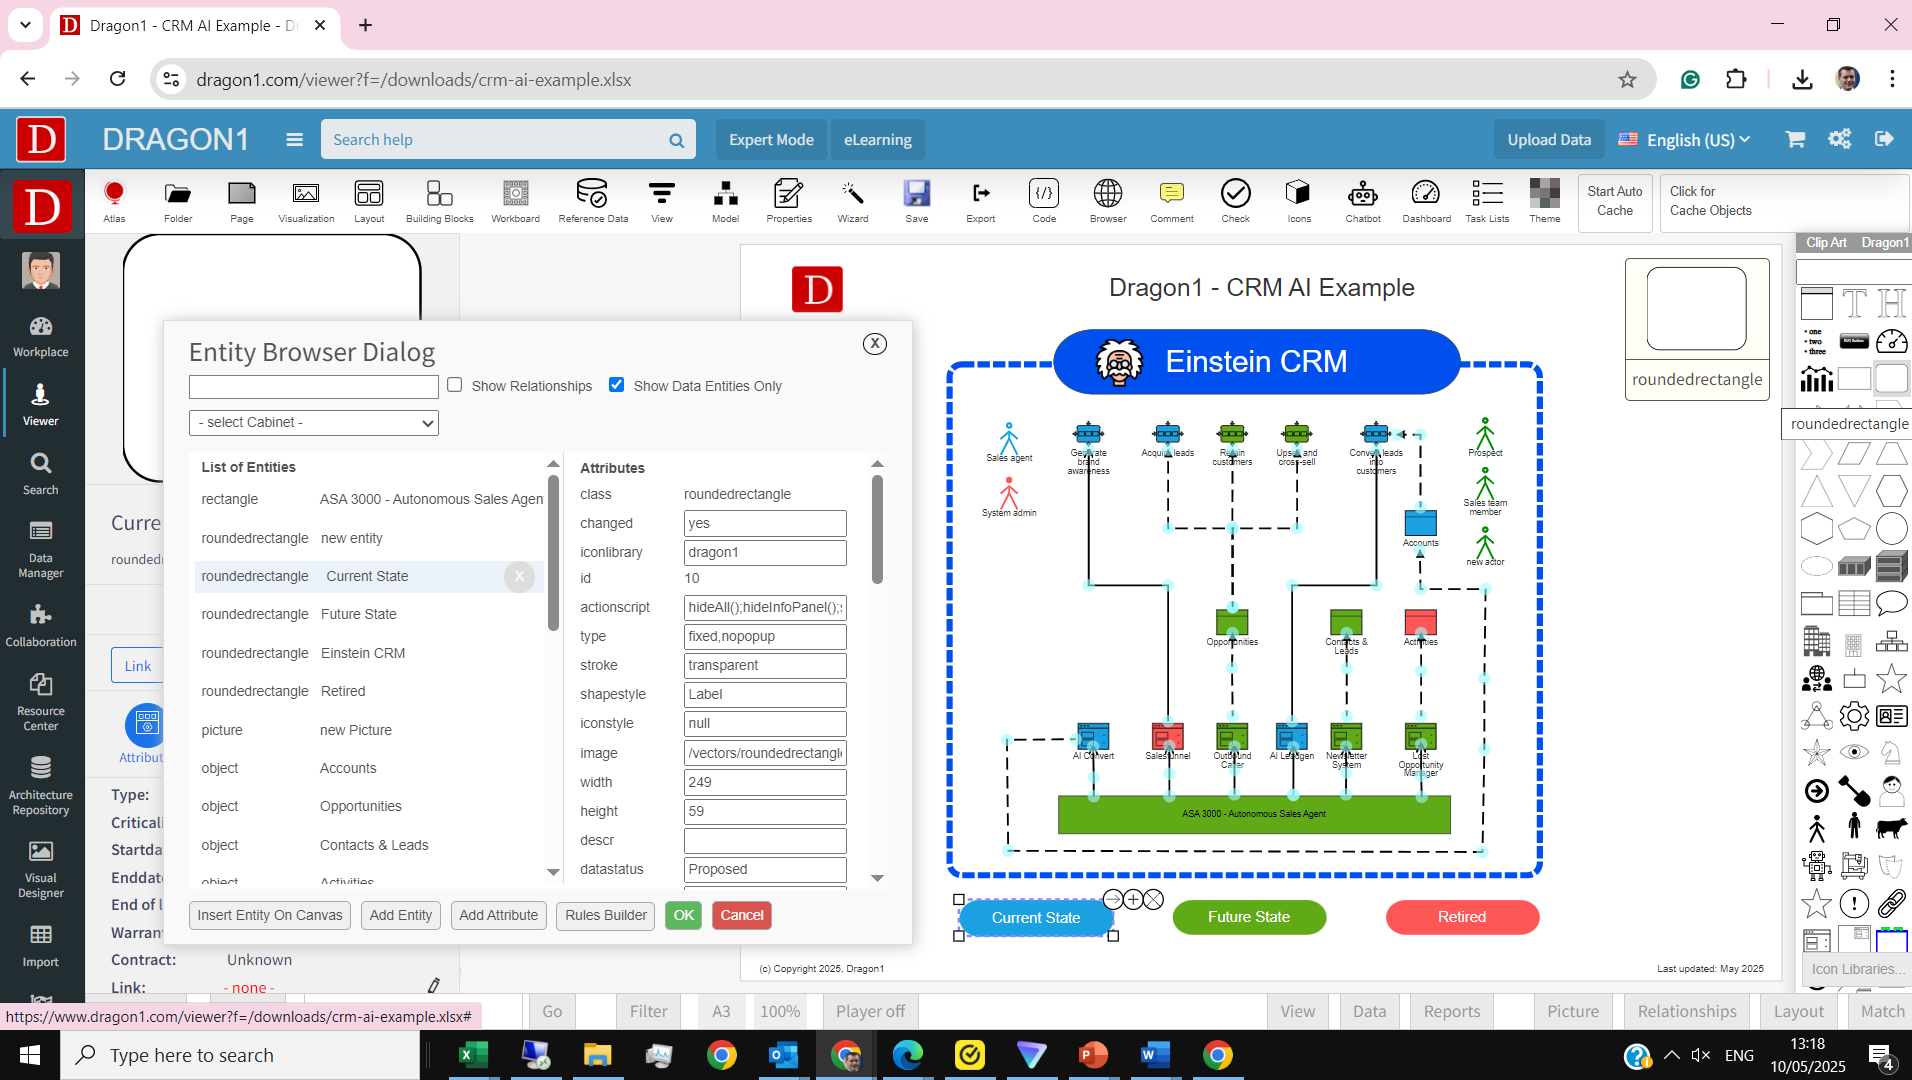
- Click the browser button.
- Select the shape in the browser button.
- Check if the actionscript attribute is already there.
- If not, add the actionscript attribute by clicking the add attribute button and entering the word actionscript in the input box.
- Specify for instance the following actionscript function: showTags(value) or colorObjects(eol,yes,red);
- The reserved keyword value used the button's text as the value.
- Place the visualization in View mode and click the button to test it.
- To prevent a pop-up from being shown on mouse over on the button, use the value nopopup in the type attribute.
- To prevent the left information panel from being shown on button click, use the value hideLeftPanel in the actionscript attribute.
- To keep the button visible, even if you want to hide all shapes, use the value fixed in the type attribute.
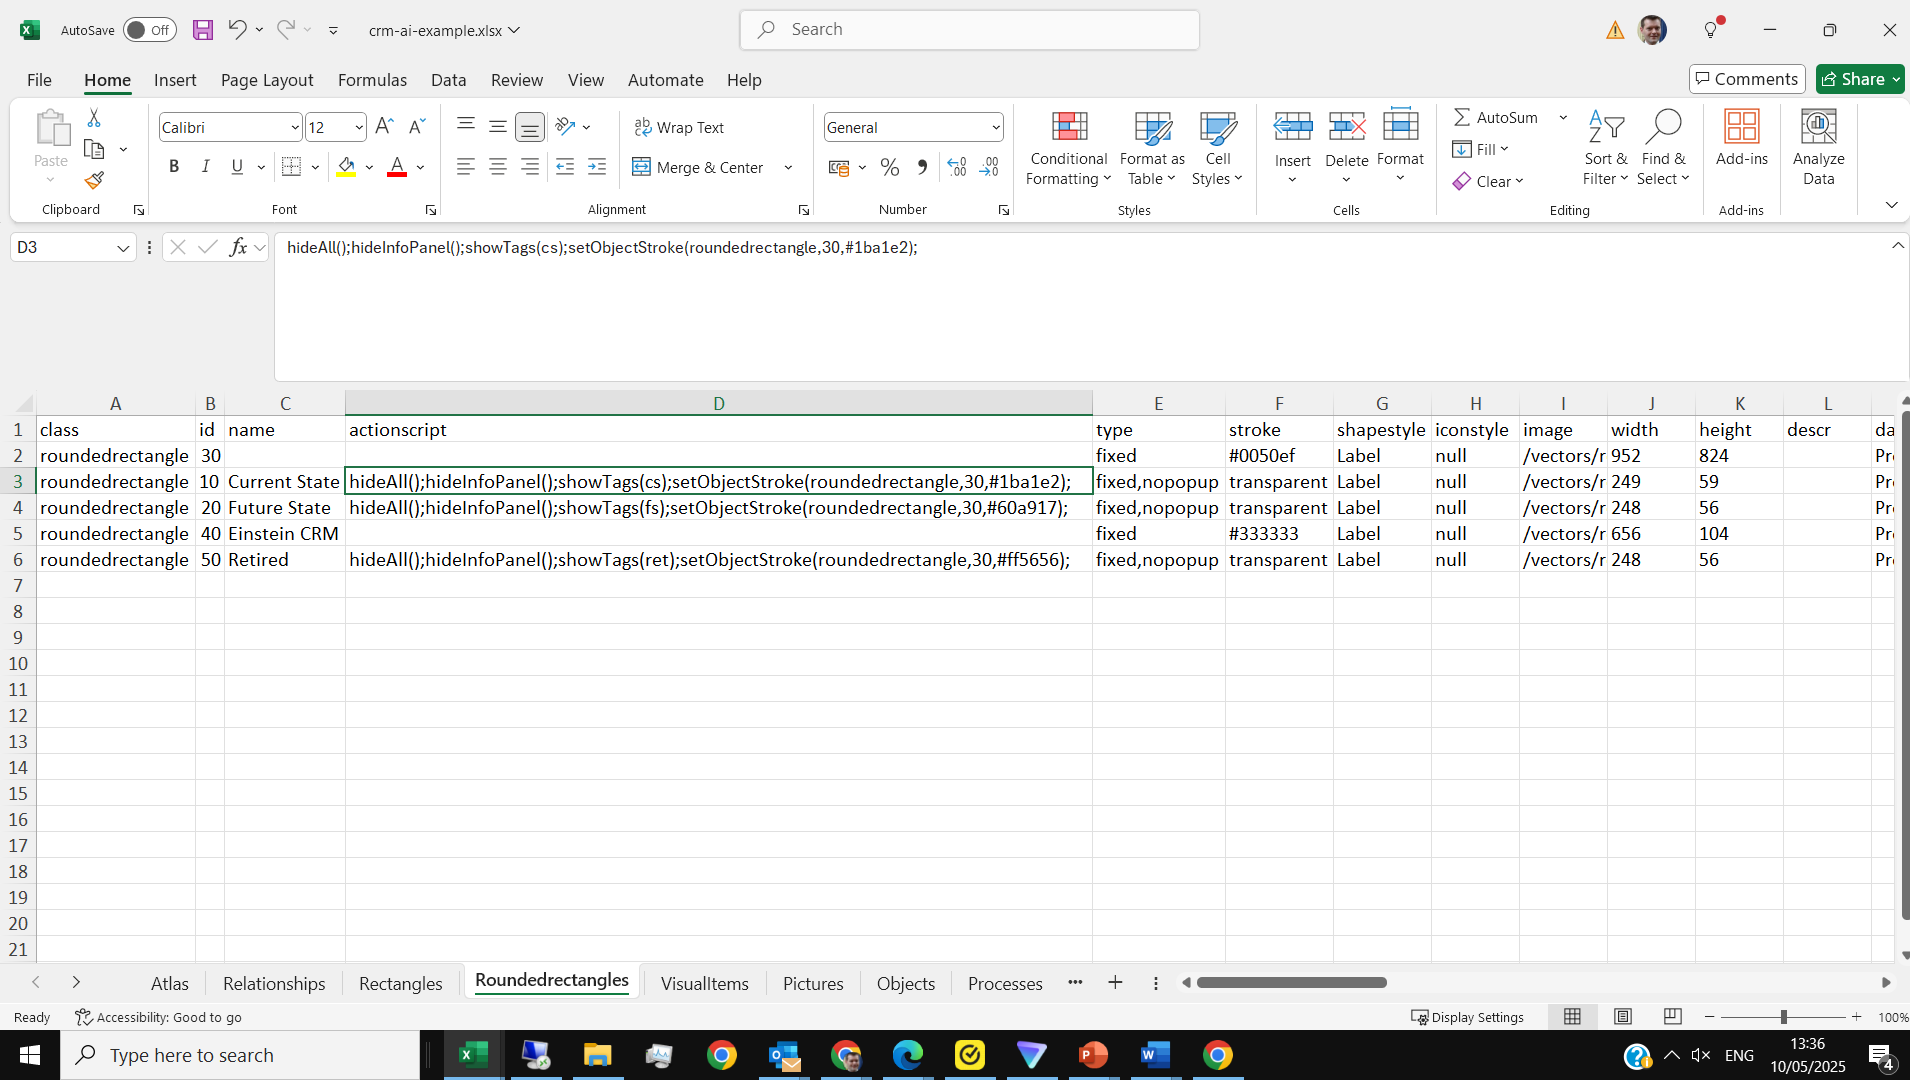
Specifying a button in Excel
Below is an example of specifying a button in a Dragon1 preformatted Excel sheet.
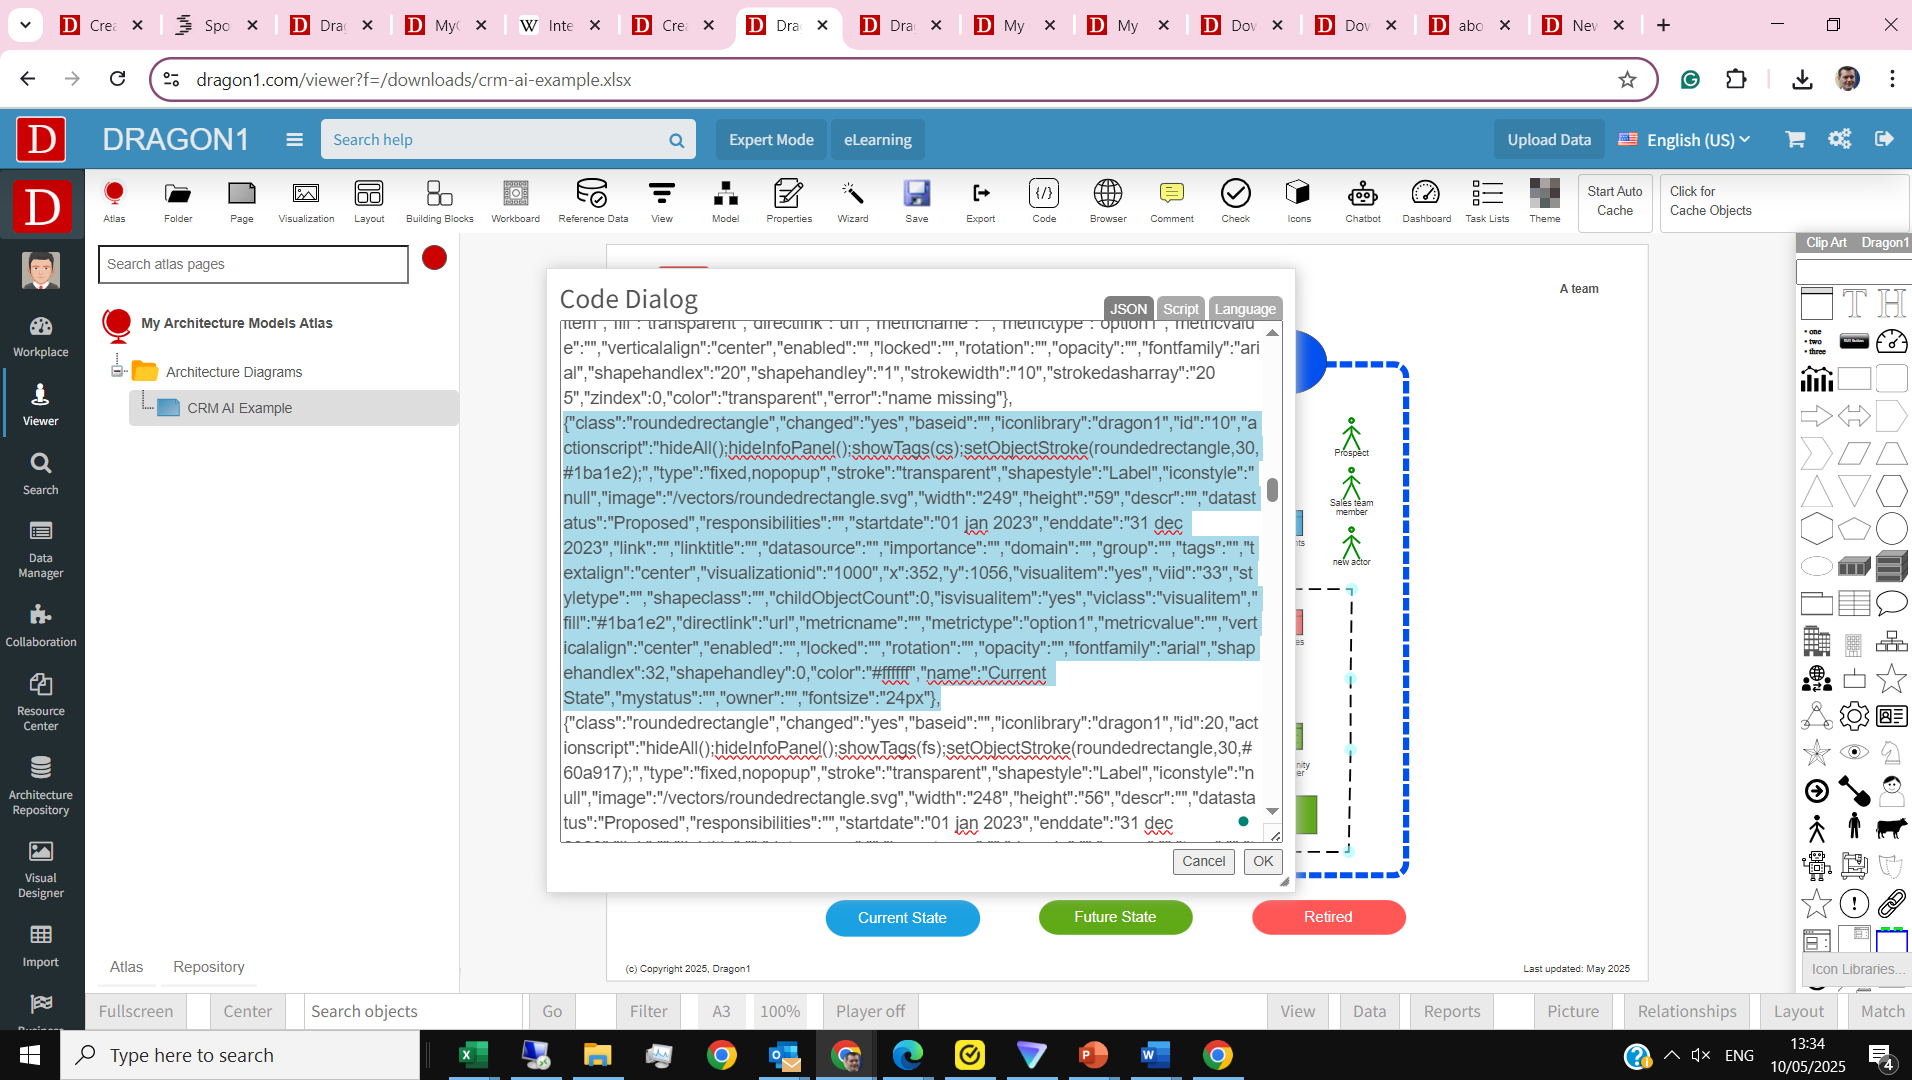
Specifying a button in JSON
Below is an example of specifying a button in a Dragon1 preformatted JSON file.


